Fanurio uses the JFreeChart library for its charts. JFreeChart can create professional quality charts and it's the most widely used chart library for Java.
Although this guide has lots of information and examples to help you create great looking charts using Freemarker, if you need to design pixel-perfect charts then you should be familiar with the JFreeChart API. This requires at least basic programming skills. The JFreeChart Developer Guide is the reference document for the JFreeChart API.
Fanurio has a custom Freemarker directive that allows you to create JFreeChart charts. The jfreechart directive generates a chart as an inline PNG image.
Note: Although the jfreechart directive can be used in any Freemarker template, it's very likely you will be using it in templates that create HTML documents. One way to include inline images in an HTML document is to add them in the src attribute of an img tag as shown in the following examples.
The jfreechart directive has the following parameters that allow you to specify the content and the looks of the chart it creates.
-
Type
The type parameter is mandatory and it specifies the kind of chart you want to create. The following example uses the 'ring' type to create a ring chart but other types are supported as well. Ring charts (also called doughnut or donut charts) are a special type of pie charts. All chart types are documented in the next section.
<img src="[@jfreechart type='ring' /]"/> -
Dataset
The dataset parameter allows you to specify the data that will be represented by the chart. Different types of charts use different formats for their data. For ring charts, the dataset parameter is a list of two-element sublists.
The following example uses a dataset to represent the time recorded on a project and the estimated remaining time.
<img src="[@jfreechart type='ring' dataset=[['Time', 39], ['Remaining', 11]] /]"/>This dataset has only two values but datasets with multiple values can be quite long. In such cases, datasets can be defined separately as shown in the following example. Please note that the last element in the list is not followed by a comma.
[#assign dataSet = [
    ['Time',  39],
    ['Remaining', 11]
] /]

<img src="[@jfreechart type='ring' dataset=dataSet /]"/>
Note: Charts that can represent data on multiple axes need to use multiple datasets instead of a single dataset. For these charts, data is specified using the datasets parameter instead of dataset. The datasets parameter is documented for each chart that supports it. See this chart for an example of how to use multiple datasets.
-
Properties
The properties parameter allows you to control the looks of the chart. Properties must be represented as a list of name and value pairs. All chart properties are documented in the next section.
The following example shows a few properties that can be used with a ring chart.
[#assign pieDataSet = [
    ['Time',  39],
    ['Remaining', 11]
] /]

<img src="[@jfreechart type='ring' dataset=dataSet properties={} /]"/>
Just like the dataset, the list of properties can be very long so it's better if you define it separately.
[#assign dataSet = [ ['Time', 39], ['Remaining', 11] ] /] [#assign chartProperties = { 'legend.visible': false, 'plot.backgroundPaint': '', 'plot.outlineVisible': false, 'plot.shadowPaint': '', 'plot.sectionOutlineStroke': [{'width': 2.0}, {'width': 0.0}], 'plot.sectionOutlinePaint': ['#87b80e'], 'plot.sectionPaint':['#a6cb4a', '#d7d7d7'], 'plot.labelGenerator': '', 'plot.centerTextMode': 'fixed', 'plot.centerText': '39 / 50', 'plot.centerTextFont': {'size': 36}, 'plot.centerTextColor': '#555555', 'plot.sectionDepth': 0.08, 'plot.separatorsVisible': false } /] <img src="[@jfreechart type='ring' dataset=dataSet properties=chartProperties /]"/> -
Width and height
Finally, the last two parameters you can use with the jfreechart directive are width and height. These parameters specify the size of the chart image. By default, the width and height are 400 pixels.

[#assign dataSet = [
    ['Time',  39],
    ['Remaining', 11]
] /]

[#assign chartProperties = {
    'legend.visible': false,

    'plot.backgroundPaint': '',
    'plot.outlineVisible': false,
    'plot.shadowPaint': '',

    'plot.sectionOutlineStroke': [{'width': 2.0}, {'width': 0.0}],
    'plot.sectionOutlinePaint': ['#87b80e'],
    'plot.sectionPaint':['#a6cb4a', '#d7d7d7'],

    'plot.labelGenerator': '',

    'plot.centerTextMode': 'fixed',
    'plot.centerText': '39 / 50',
    'plot.centerTextFont': {'size': 36},
    'plot.centerTextColor': '#555555',

    'plot.sectionDepth': 0.08,
    'plot.separatorsVisible': false
} /]

<img src="[@jfreechart type='ring' dataset=dataSet properties=chartProperties width=500 height=250 /]"/>
Although JFreeChart can create many types of charts, only the types documented in this section are supported by the jfreechart directive. More types may be supported in the future.
If you haven't used charts before, these resources explain them in more detail:
An area chart is a line chart with the areas below the lines filled with colors to indicate volume. Area charts are most often used to visualize data that changes over time. They are perfect for communicating the overall trend.
If you haven't used area charts before, these resources explain them in more detail:
In order to create an area chart that uses texts (categories) on the domain axis, the jfreechart directive must be used with the following parameters:
Table 4.1. The jfreechart directive parameters for category area charts
| Parameter | Value |
|---|---|
| type | area |
| dataset |
A sequence of the following form: [ [Heading , Series1 , ... Seriesn], [xValue1 , yValue11, ... yValuen1], ... [xValuek , yValue1k, ... yValuenk] ] where:
|
| datasets |
A sequence of the following form: [dataset1, dataset2, ... datasetn] where dataseti is a dataset defined according to the above format. This chart can use one dataset if the dataset parameter is used or multiple datasets if the datasets parameter is used. It doesn't accept datasets specified using both parameters at the same time. The datasets parameter is used by charts with multiple axes. |
| properties | The following properties are accepted:
|
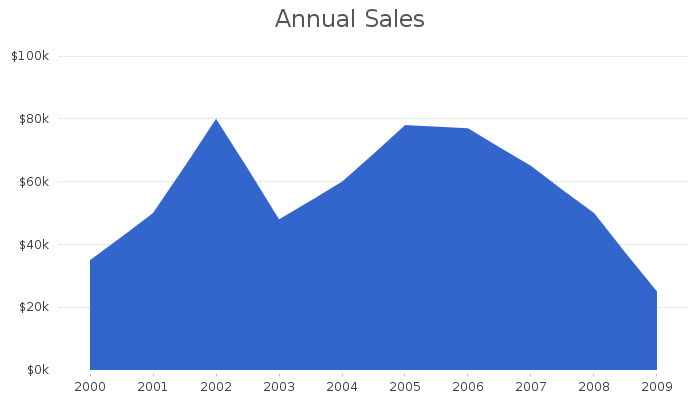
The following example creates an area chart that shows the annual sales of a fictitious company over several years.
[#assign dataSet = [
  ['Year', 'Annual Sales'],
  ['2000', 35],
  ['2001', 50],
  ['2002', 80],
  ['2003', 48],
  ['2004', 60],
  ['2005', 78],
  ['2006', 77],
  ['2007', 65],
  ['2008', 50],
  ['2009', 25]
] /]

[#assign chartProperties = {
    'title': 'Annual Sales',
    'title.horizontalAlignment': 'center',
    'title.font': {'size': 24},
    'title.padding': [5, 0, 15, 0],
    'title.paint': '#555555',

    'legend.visible': false,

    'plot.backgroundPaint': '',
    'plot.outlineVisible': false,

    'plot.rangeGridlinesVisible': true,
    'plot.rangeGridlinePaint': '#aaaaaa',
    'plot.domainGridlinesVisible': false,

    'plot.domainAxis.axisLineVisible': false,
    'plot.domainAxis.lowerMargin': 0.00,
    'plot.domainAxis.upperMargin': 0.00,

    'plot.rangeAxis.axisLineVisible': false,
    'plot.rangeAxis.numberFormatOverride': '${"$"}#0k',
    'plot.rangeAxis.lowerMargin': 0.00,
    'plot.rangeAxis.upperMargin': 0.00,
    'plot.rangeAxis.tickMarksVisible': false,
    'plot.rangeAxis.tickUnit': {'size': 20},
    'plot.rangeAxis.range': [0, 100],

    'plot.renderer.endType': 'truncate'
} /]

<img src="[@jfreechart type='area' dataset=dataSet properties=chartProperties width=700 height=400 /]"/>
In order to create an area chart that uses numbers on the domain axis, the jfreechart directive must be used with the following parameters:
Table 4.2. The jfreechart directive parameters for xy area charts
| Parameter | Value |
|---|---|
| type | xyarea |
| dataset |
A sequence of the following form: [ [Heading , Series1 , ... Seriesn], [xValue1 , yValue11, ... yValuen1], ... [xValuek , yValue1k, ... yValuenk] ] where:
|
| datasets |
A sequence of the following form: [dataset1, dataset2, ... datasetn] where dataseti is a dataset defined according to the above format. This chart can use one dataset if the dataset parameter is used or multiple datasets if the datasets parameter is used. It doesn't accept datasets specified using both parameters at the same time. The datasets parameter is used by charts with multiple axes. |
| properties | The following properties are accepted:
|
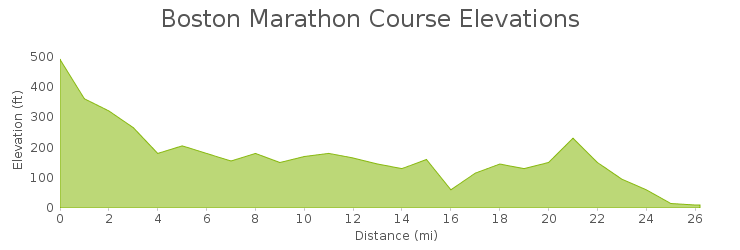
The following example shows the course elevation chart of the Boston Marathon. The Boston Marathon is an annual marathon hosted by several cities in greater Boston in eastern Massachusetts, United States.
[#-- http://www.boston.com/sports/marathon/course/elevations/ --]
[#assign dataSet = [
  ['Mile', 'Elevation in feet'],
  [ 0.0, 490],
  [ 1.0, 360],
  [ 2.0, 320],
  [ 3.0, 265],
  [ 4.0, 180],
  [ 5.0, 205],
  [ 6.0, 180],
  [ 7.0, 155],
  [ 8.0, 180],
  [ 9.0, 150],
  [10.0, 170],
  [11.0, 180],
  [12.0, 165],
  [13.0, 145],
  [14.0, 130],
  [15.0, 160],
  [16.0,  60],
  [17.0, 115],
  [18.0, 145],
  [19.0, 130],
  [20.0, 150],
  [21.0, 230],
  [22.0, 150],
  [23.0,  95],
  [24.0,  60],
  [25.0,  15],
  [26.0,  10],
  [26.2,  10]
] /]

[#assign chartProperties = {
    'title': 'Boston Marathon Course Elevations',
    'title.horizontalAlignment': 'center',
    'title.font': {'size': 24},
    'title.padding': [5, 0, 15, 0],
    'title.paint': '#555555',

    'plot.axisOffset': [0, 0, 0, 0],
    'plot.backgroundPaint': '',
    'plot.outlineVisible': false,
    'plot.rangeGridlinesVisible': false,
    'plot.domainGridlinesVisible': false,
    'plot.foregroundAlpha': 1.0,

    'plot.renderer.seriesPaint': ['rgba(166, 203, 74, 0.75)'],
    'plot.renderer.seriesOutlinePaint': ['#87b80e'],
    'plot.renderer.outline': true,

    'plot.domainAxis.axisLineVisible': false,
    'plot.domainAxis.label': 'Distance (mi)',
    'plot.domainAxis.labelPaint': '#555555',
    'plot.domainAxis.labelFont': {'size': 12},
    'plot.domainAxis.tickLabelFont': {'size': 12},
    'plot.domainAxis.tickLabelPaint': '#555555',
    'plot.domainAxis.tickUnit': {'size': 2},

    'plot.rangeAxis.axisLineVisible': false,
    'plot.rangeAxis.label': 'Elevation (ft)',
    'plot.rangeAxis.labelPaint': '#555555',
    'plot.rangeAxis.labelFont': {'size': 12},
    'plot.rangeAxis.tickLabelFont': {'size': 12},
    'plot.rangeAxis.tickLabelPaint': '#555555',
    'plot.rangeAxis.tickMarksVisible': false,
    'plot.rangeAxis.tickUnit': {'size': 100},

    'legend.visible': false
} /]

<img src="[@jfreechart type='xyarea' dataset=dataSet properties=chartProperties width=740 height=250 /]"/>
In order to create an area chart that uses dates/times on the domain axis, the jfreechart directive must be used with the following parameters:
Table 4.3. The jfreechart directive parameters for time series area charts
| Parameter | Value |
|---|---|
| type | timeseriesarea |
| dataset |
A sequence of the following form: [ [Heading , Series1 , ... Seriesn], [xValue1 , yValue11, ... yValuen1], ... [xValuek , yValue1k, ... yValuenk] ] where:
|
| datasets |
A sequence of the following form: [dataset1, dataset2, ... datasetn] where dataseti is a dataset defined according to the above format. This chart can use one dataset if the dataset parameter is used or multiple datasets if the datasets parameter is used. It doesn't accept datasets specified using both parameters at the same time. The datasets parameter is used by charts with multiple axes. |
| properties | The following properties are accepted:
|
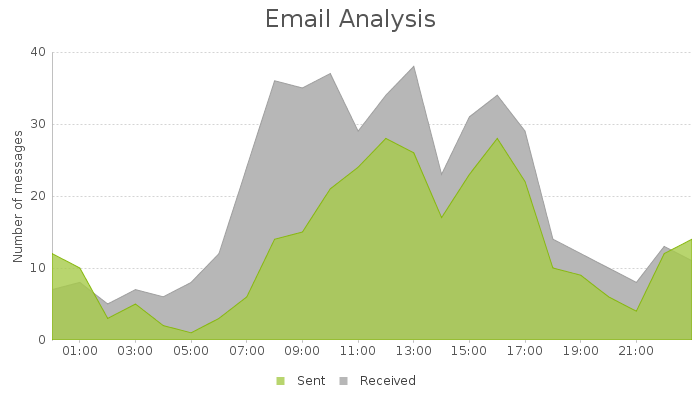
The following example creates an area chart that compares the number of email messages sent and received by a fictitious email account.
This chart sets the 'plot.foregroundAlpha' property to 1.0 (the default is 0.5) and uses a semi-transparent color for the first series. The color is specified using the rgba format, rgba(166, 203, 74, 0.8) which means that the color has an opacity of 80%.
[#assign dataSet = [
  ['Date', 'Sent', 'Received'],
  ['2013-01-01T00:00'?datetime.iso, 12,  7],
  ['2013-01-01T01:00'?datetime.iso, 10,  8],
  ['2013-01-01T02:00'?datetime.iso,  3,  5],
  ['2013-01-01T03:00'?datetime.iso,  5,  7],
  ['2013-01-01T04:00'?datetime.iso,  2,  6],
  ['2013-01-01T05:00'?datetime.iso,  1,  8],
  ['2013-01-01T06:00'?datetime.iso,  3, 12],
  ['2013-01-01T07:00'?datetime.iso,  6, 24],
  ['2013-01-01T08:00'?datetime.iso, 14, 36],
  ['2013-01-01T09:00'?datetime.iso, 15, 35],
  ['2013-01-01T10:00'?datetime.iso, 21, 37],
  ['2013-01-01T11:00'?datetime.iso, 24, 29],
  ['2013-01-01T12:00'?datetime.iso, 28, 34],
  ['2013-01-01T13:00'?datetime.iso, 26, 38],
  ['2013-01-01T14:00'?datetime.iso, 17, 23],
  ['2013-01-01T15:00'?datetime.iso, 23, 31],
  ['2013-01-01T16:00'?datetime.iso, 28, 34],
  ['2013-01-01T17:00'?datetime.iso, 22, 29],
  ['2013-01-01T18:00'?datetime.iso, 10, 14],
  ['2013-01-01T19:00'?datetime.iso,  9, 12],
  ['2013-01-01T20:00'?datetime.iso,  6, 10],
  ['2013-01-01T21:00'?datetime.iso,  4,  8],
  ['2013-01-01T22:00'?datetime.iso, 12, 13],
  ['2013-01-01T23:00'?datetime.iso, 14, 11]
] /]

[#assign chartProperties = {
    'title': 'Email Analysis',
    'title.horizontalAlignment': 'center',
    'title.font': {'size': 24},
    'title.padding': [5, 0, 15, 0],
    'title.paint': '#555555',

    'legend.visible': true,
    'legend.frame': {"insets": [0, 0, 0, 0]},
    'legend.itemLabelPadding': [10, 10, 10, 10],

    'plot.axisOffset': [0, 0, 0, 0],
    'plot.backgroundPaint': '',
    'plot.outlineVisible': false,
    'plot.rangeGridlinesVisible': true,
    'plot.rangeGridlinePaint': '#aaaaaa',
    'plot.domainGridlinesVisible': false,
    'plot.foregroundAlpha': 1.0,

    'plot.domainAxis.axisLineVisible': false,
    'plot.domainAxis.labelPaint': '#555555',
    'plot.domainAxis.labelFont': {'size': 12},
    'plot.domainAxis.tickLabelFont': {'size': 12},
    'plot.domainAxis.tickLabelPaint': '#555555',

    'plot.rangeAxis.axisLineVisible': true,
    'plot.rangeAxis.label': 'Number of messages',
    'plot.rangeAxis.labelPaint': '#555555',
    'plot.rangeAxis.labelFont': {'size': 12},
    'plot.rangeAxis.tickLabelFont': {'size': 12},
    'plot.rangeAxis.tickLabelPaint': '#555555',
    'plot.rangeAxis.tickMarksVisible': false,
    'plot.rangeAxis.tickUnit': {'size': 10},
    'plot.rangeAxis.range': [0, 40],

    'plot.renderer.seriesPaint': ['rgba(166, 203, 74, 0.8)', 'rgb(183, 183, 183)'],
    'plot.renderer.seriesOutlinePaint': ['rgb(135, 184, 14)', 'rgb(158, 158, 158)'],
    'plot.renderer.legendArea': {'shape': 'rectangle', 'x': 0, 'y': 0, 'width': 8, 'height': 8},
    'plot.renderer.outline': true
} /]

<img src="[@jfreechart type='timeseriesarea' dataset=dataSet properties=chartProperties width=700 height=400 /]"/>
A bar chart is a two-axis chart with rectangular bars that can be either vertical or horizontal. Bar charts can help you:
-
show change over time,
-
compare values of different categories, and
-
compare parts of a whole.
If you haven't used bar charts before, these resources explain them in more detail:
In order to create a bar chart, the jfreechart directive must be used with the following parameters:
Table 4.4. The jfreechart directive parameters for bar charts
| Parameter | Value |
|---|---|
| type | bar |
| dataset |
A sequence of the following form: [ [Heading , Series1 , ... Seriesn], [xValue1 , yValue11, ... yValuen1], ... [xValuek , yValue1k, ... yValuenk] ] where:
|
| datasets |
A sequence of the following form: [dataset1, dataset2, ... datasetn] where dataseti is a dataset defined according to the above format. This chart can use one dataset if the dataset parameter is used or multiple datasets if the datasets parameter is used. It doesn't accept datasets specified using both parameters at the same time. The datasets parameter is used by charts with multiple axes. |
| properties | The following properties are accepted:
|
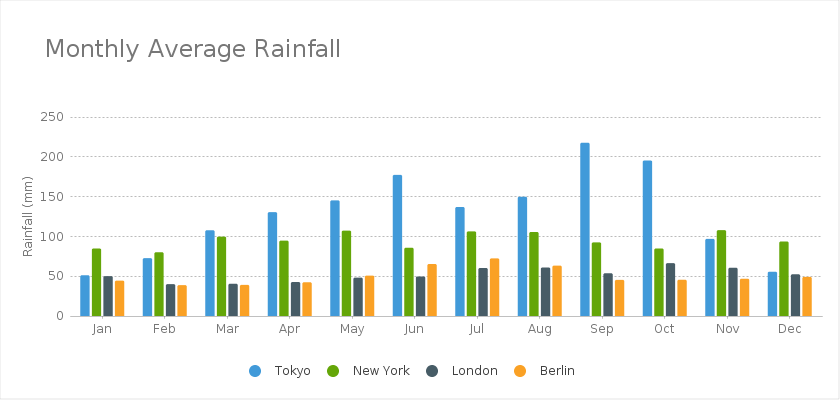
The following example creates a bar chart that shows the monthly average rainfall in four major cities.
[#-- http://www.worldclimate.com/ --]
[#assign categoryDataSet = [
  ['Month', 'Tokyo', 'New York', 'London', 'Berlin'],
  [  'Jan',    49.9,       83.6,     48.9,     43.2],
  [  'Feb',    71.5,       78.8,     38.8,     37.6],
  [  'Mar',   106.4,       98.5,     39.3,     37.8],
  [  'Apr',   129.2,       93.4,     41.4,     41.1],
  [  'May',   144.0,      106.0,     47.0,     49.4],
  [  'Jun',   176.0,       84.5,     48.3,     64.1],
  [  'Jul',   135.6,      105.0,     59.0,     71.1],
  [  'Aug',   148.5,      104.3,     59.6,     62.1],
  [  'Sep',   216.4,       91.2,     52.4,     44.1],
  [  'Oct',   194.1,       83.5,     65.2,     44.3],
  [  'Nov',    95.6,      106.6,     59.3,     45.5],
  [  'Dec',    54.4,       92.3,     51.2,     47.9]
] /]

[#assign chartProperties = {
    'borderPaint': '#777777',
    'borderVisible': true,
    'padding': [20, 10, 20, 10],
    'borderStroke': {'width': 0.2},

    'title': 'Monthly Average Rainfall',
    'title.font': {'size': 24},
    'title.horizontalAlignment': 'left',
    'title.padding': [15, 35, 50, 5],
    'title.paint': '#777777',

    'legend.position': 'bottom',
    'legend.frame': {"insets": [0, 0, 0, 0]},
    'legend.itemLabelPadding': [20, 15, 0, 15],
    'legend.legendItemGraphicPadding': [20, 0, 0, 0],
    'plot.renderer.baseLegendShape': {'shape': 'ellipse', 'width': 10, 'height': 10},

    'plot.renderer.seriesPaint': ['#419ad9', '#64a608', '#475c66', '#faa125'],

    'plot.renderer.drawBarOutline': true,
    'plot.renderer.baseOutlineStroke': {'width': 2.0, 'cap': 2, 'join': 2},
    'plot.renderer.seriesOutlinePaint': ['#419ad9', '#64a608', '#475c66', '#faa125'],

    'plot.axisOffset': [0, 0, 0, 0],
    'plot.rangeGridlinesVisible': true,
    'plot.rangeGridlinePaint': '#777777',

    'plot.domainAxis.categoryMargin': 0.3,
    'plot.domainAxis.lowerMargin': 0.015,
    'plot.domainAxis.upperMargin': 0.015,
    'plot.domainAxis.tickLabelPaint': '#777777',

    'plot.rangeAxis.axisLineVisible': false,
    'plot.rangeAxis.label': 'Rainfall (mm)',
    'plot.rangeAxis.labelFont': {'size': 12},
    'plot.rangeAxis.labelPaint': '#777777',
    'plot.rangeAxis.tickLabelPaint': '#777777',
    'plot.rangeAxis.tickMarksVisible': false,
    'plot.rangeAxis.tickUnit': {'size': 50},
    'plot.rangeAxis.range': [0, 250],

    'plot.backgroundPaint': '',
    'plot.outlineVisible': false
} /]

<img src="[@jfreechart type='bar' dataset=categoryDataSet properties=chartProperties width=840 height=403 /]"/>In order to create a stacked bar chart, the jfreechart directive must be used with the following parameters:
Table 4.5. The jfreechart directive parameters for stacked bar charts
| Parameter | Value |
|---|---|
| type | stackedbar |
| dataset |
A sequence of the following form: [ [Heading , Series1 , ... Seriesn], [xValue1 , yValue11, ... yValuen1], ... [xValuek , yValue1k, ... yValuenk] ] where:
|
| datasets |
A sequence of the following form: [dataset1, dataset2, ... datasetn] where dataseti is a dataset defined according to the above format. This chart can use one dataset if the dataset parameter is used or multiple datasets if the datasets parameter is used. It doesn't accept datasets specified using both parameters at the same time. The datasets parameter is used by charts with multiple axes. |
| properties | The following properties are accepted:
|
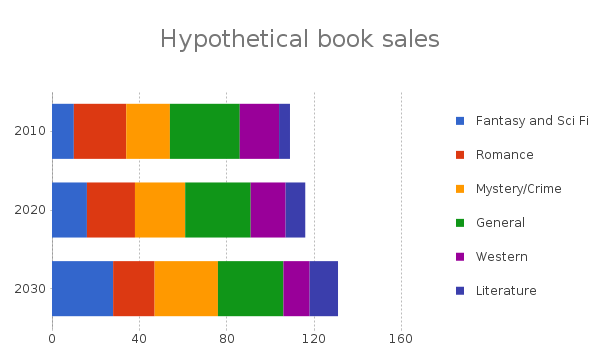
The following example creates a stacked bar chart that shows hypothetical book sales, divided by genre and compared across time.
[#assign categoryDataSet = [
  ['Genre', 'Fantasy and Sci Fi', 'Romance', 'Mystery/Crime', 'General', 'Western', 'Literature'],
  ['2010', 10, 24, 20, 32, 18, 5],
  ['2020', 16, 22, 23, 30, 16, 9],
  ['2030', 28, 19, 29, 30, 12, 13]
] /]

[#assign chartProperties = {
    'title': 'Hypothetical book sales',
    'title.font': {'size': 24},
    'title.padding': [5, 5, 15, 5],
    'title.paint': '#777777',

    'legend.position': 'right',
    'legend.verticalAlignment': 'top',
    'legend.frame': {"insets": [0, 0, 0, 0]},
    'legend.margin': [15, 0, 0, 0],
    'legend.itemLabelPadding': [10, 10, 10, 10],

    'plot.axisOffset': [0, 0, 0, 0],
    'plot.rangeAxisLocation': 'bottom or right',
    'plot.rangeGridlinesVisible': true,
    'plot.rangeGridlinePaint': '#777777',

    'plot.rangeAxis.axisLineVisible': false,
    'plot.rangeAxis.tickUnit': {'size': 40},
    'plot.rangeAxis.range': [0, 180],

    'plot.orientation': 'horizontal',
    'plot.backgroundPaint': '',
    'plot.outlineVisible': false
} /]

<img src="[@jfreechart type='stackedbar' dataset=categoryDataSet properties=chartProperties width=600 height=300 /]"/>
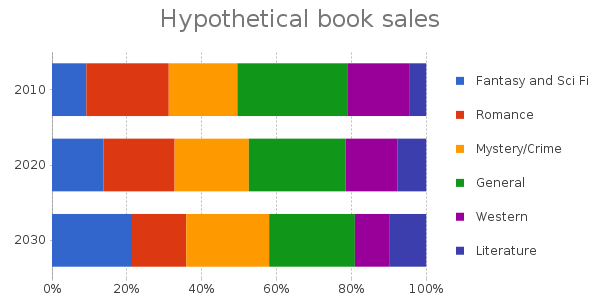
This chart can be configured to show percentages if the 'plot.renderer.renderAsPercentages' property is used. The range axis also needs to use a percentage format ('plot.renderer.renderAsPercentages') to show percentages. The following chart emphasizes these two properties.
[#assign categoryDataSet = [
  ['Genre', 'Fantasy and Sci Fi', 'Romance', 'Mystery/Crime', 'General', 'Western', 'Literature'],
  ['2010', 10, 24, 20, 32, 18, 5],
  ['2020', 16, 22, 23, 30, 16, 9],
  ['2030', 28, 19, 29, 30, 12, 13]
] /]

[#assign chartProperties = {
    'title': 'Hypothetical book sales',
    'title.font': {'size': 24},
    'title.padding': [5, 5, 15, 5],
    'title.paint': '#777777',

    'legend.position': 'right',
    'legend.verticalAlignment': 'top',
    'legend.frame': {"insets": [0, 0, 0, 0]},
    'legend.margin': [15, 0, 0, 0],
    'legend.itemLabelPadding': [10, 10, 10, 10],

    'plot.axisOffset': [0, 0, 0, 0],
    'plot.rangeAxisLocation': 'bottom or right',
    'plot.rangeGridlinesVisible': true,
    'plot.rangeGridlinePaint': '#777777',

    'plot.rangeAxis.axisLineVisible': false,
    'plot.rangeAxis.numberFormatOverride': '0%',
    'plot.renderer.renderAsPercentages': true,

    'plot.orientation': 'horizontal',
    'plot.backgroundPaint': '',
    'plot.outlineVisible': false
} /]

<img src="[@jfreechart type='stackedbar' dataset=categoryDataSet properties=chartProperties width=600 height=300 /]"/>
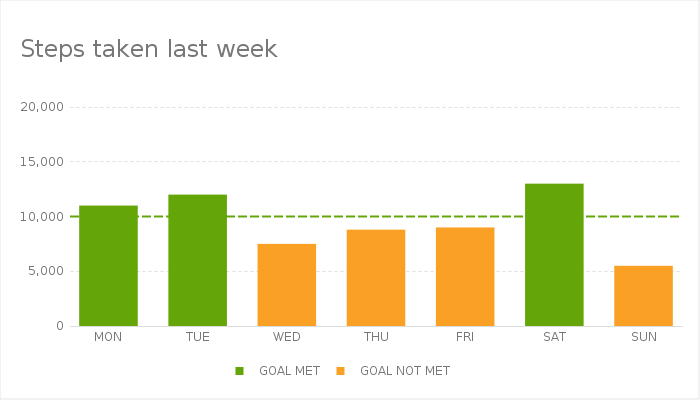
Here's another example that uses a stacked bar chart to show whether a goal was met or not.
[#assign categoryDataSet = [
  ['DAY', 'GOAL MET', 'GOAL NOT MET'],
  ['MON', 11000,    0],
  ['TUE', 12000,    0],
  ['WED',     0, 7500],
  ['THU',     0, 8800],
  ['FRI',     0, 9000],
  ['SAT', 13000,    0],
  ['SUN',     0, 5500]
] /]

[#assign chartProperties = {
    'borderPaint': '#777777',
    'borderVisible': true,
    'padding': [20, 10, 20, 10],
    'borderStroke': {'width': 0.2},

    'title': 'Steps taken last week',
    'title.font': {'size': 24},
    'title.horizontalAlignment': 'left',
    'title.padding': [15, 10, 40, 5],
    'title.paint': '#777777',

    'legend.visible': true,
    'legend.frame': {'insets': [0, 0, 0, 0]},
    'legend.position': 'bottom',
    'legend.verticalAlignment': 'top',
    'legend.itemPaint': '#777777',
    'legend.itemLabelPadding': [10, 15, 0, 15],
    'legend.legendItemGraphicPadding': [10, 0, 0, 0],
    'legend.backgroundPaint': '',

    'plot.renderer.seriesPaint': ['#64a608', '#faa125'],

    'plot.axisOffset': [0, 0, 0, 0],

    'plot.rangeGridlinesVisible': true,
    'plot.rangeGridlinePaint': '#777777',
    'plot.rangeGridlineStroke': {'width': 0.1, 'cap': 0, 'join': 2, 'dash': [3.0, 3.0, 3.0, 3.0]},

    'plot.rangeCrosshairValue': 10000,
    'plot.rangeCrosshairVisible': true,
    'plot.rangeCrosshairPaint': '#64a608',
    'plot.rangeCrosshairStroke': {'width': 2.0, 'cap': 0, 'join': 2, 'dash': [9.0, 3.0]},

    'plot.domainAxis.axisLinePaint': '#bbbbbb',
    'plot.domainAxis.categoryMargin': 0.3,
    'plot.domainAxis.lowerMargin': 0.015,
    'plot.domainAxis.upperMargin': 0.015,
    'plot.domainAxis.tickLabelPaint': '#777777',
    'plot.domainAxis.tickMarksVisible': false,

    'plot.rangeAxis.axisLineVisible': false,
    'plot.rangeAxis.tickLabelPaint': '#777777',
    'plot.rangeAxis.tickMarksVisible': false,
    'plot.rangeAxis.tickUnit': {'size': 5000},
    'plot.rangeAxis.range': [0, 20000],

    'plot.backgroundPaint': '',
    'plot.outlineVisible': false
} /]

<img src="[@jfreechart type='stackedbar' dataset=categoryDataSet properties=chartProperties width=700 height=400 /]"/>
A line chart is a type of two-axis chart that presents data as a series of points connected by straight lines. Line charts are most often used to visualize data that changes over time. Line charts can help you:
-
See overall patterns, such as trends, fluctuations, cycles and rates of change so you can make predictions about data not yet recorded.
-
Analyze and compare multiple data sets so you can see if there is any correlation between them. Some experts recommend no more than 4 lines on a single graph; any more than that and it becomes difficult to interpret.
If you haven't used line charts before, these resources explain them in more detail:
In order to create a line chart that uses texts (categories) on the domain axis, the jfreechart directive must be used with the following parameters:
Table 4.6. The jfreechart directive parameters for category line charts
| Parameter | Value |
|---|---|
| type | line |
| dataset |
A sequence of the following form: [ [Heading , Series1 , ... Seriesn], [xValue1 , yValue11, ... yValuen1], ... [xValuek , yValue1k, ... yValuenk] ] where:
|
| datasets |
A sequence of the following form: [dataset1, dataset2, ... datasetn] where dataseti is a dataset defined according to the above format. This chart can use one dataset if the dataset parameter is used or multiple datasets if the datasets parameter is used. It doesn't accept datasets specified using both parameters at the same time. The datasets parameter is used by charts with multiple axes. |
| properties | The following properties are accepted:
|
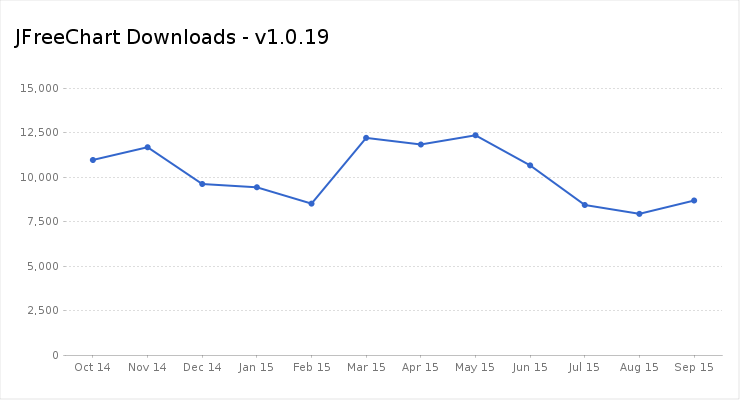
The following example creates a line chart with just one line that shows the downloads for JFreeChart version 1.0.19 between October 2014 and September 2015. The downloads from each month are represented as a circle.
[#-- http://sf.net/projects/jfreechart/files/1.%20JFreeChart/1.0.19/jfreechart-1.0.19.zip/stats/timeline?dates=2014-10-01+to+2015-09-30 --]

[#assign dataSet = [
  ['Month', 'Downloads'],
  ['Oct 14', 10958],
  ['Nov 14', 11673],
  ['Dec 14', 9606],
  ['Jan 15', 9421],
  ['Feb 15', 8504],
  ['Mar 15', 12197],
  ['Apr 15', 11827],
  ['May 15', 12343],
  ['Jun 15', 10652],
  ['Jul 15', 8428],
  ['Aug 15', 7931],
  ['Sep 15', 8677]
] /]

[#assign chartProperties = {
    'borderPaint': '#777777',
    'borderVisible': true,
    'padding': [20, 10, 20, 10],
    'borderStroke': {'width': 0.2},

    'title': 'JFreeChart Downloads - v1.0.19',
    'title.font': {'size': 20},
    'title.padding': [5, 5, 35, 5],
    'title.horizontalAlignment': 'left',

    'legend.visible': false,

    'plot.renderer.baseFillPaint': '#3366cc',
    'plot.renderer.drawOutlines': true,
    'plot.renderer.baseShapesVisible': true,
    'plot.renderer.baseLinesVisible': true,
    'plot.renderer.baseShapesFilled': true,
    'plot.renderer.useFillPaint': true,
    'plot.renderer.seriesShape': [{'shape': 'ellipse', 'x': -2, 'y': -2, 'width': 4, 'height': 4}],
    'plot.renderer.seriesStroke': [{'width': 2.0}],
    'plot.renderer.seriesOutlineStroke': [{'width': 2.0}],

    'plot.axisOffset': [0, 0, 0, 0],
    'plot.rangeGridlinesVisible': true,
    'plot.rangeGridlinePaint': '#bbbbbb',
    'plot.rangeGridlineStroke': {'width': 1.0, 'cap': 0, 'join': 2, 'miterlimit': 0.0, 'dash': [1.0, 3.0]},

    'plot.domainAxis.lowerMargin': 0.01,
    'plot.domainAxis.upperMargin': 0.01,
    'plot.domainAxis.tickLabelPaint': '#777777',
    'plot.domainAxis.tickLabelFont': {'size': 11},

    'plot.rangeAxis.tickLabelPaint': '#777777',
    'plot.rangeAxis.tickLabelFont': {'size': 11},
    'plot.rangeAxis.axisLineVisible': false,
    'plot.rangeAxis.tickUnit': {'size': 2500},
    'plot.rangeAxis.range': [0, 15000],

    'plot.backgroundPaint': '',
    'plot.outlineVisible': false
} /]

<img src="[@jfreechart type='line' dataset=dataSet properties=chartProperties width=740 height=400 /]"/>
The following chart uses two datasets and two axes to represent them:
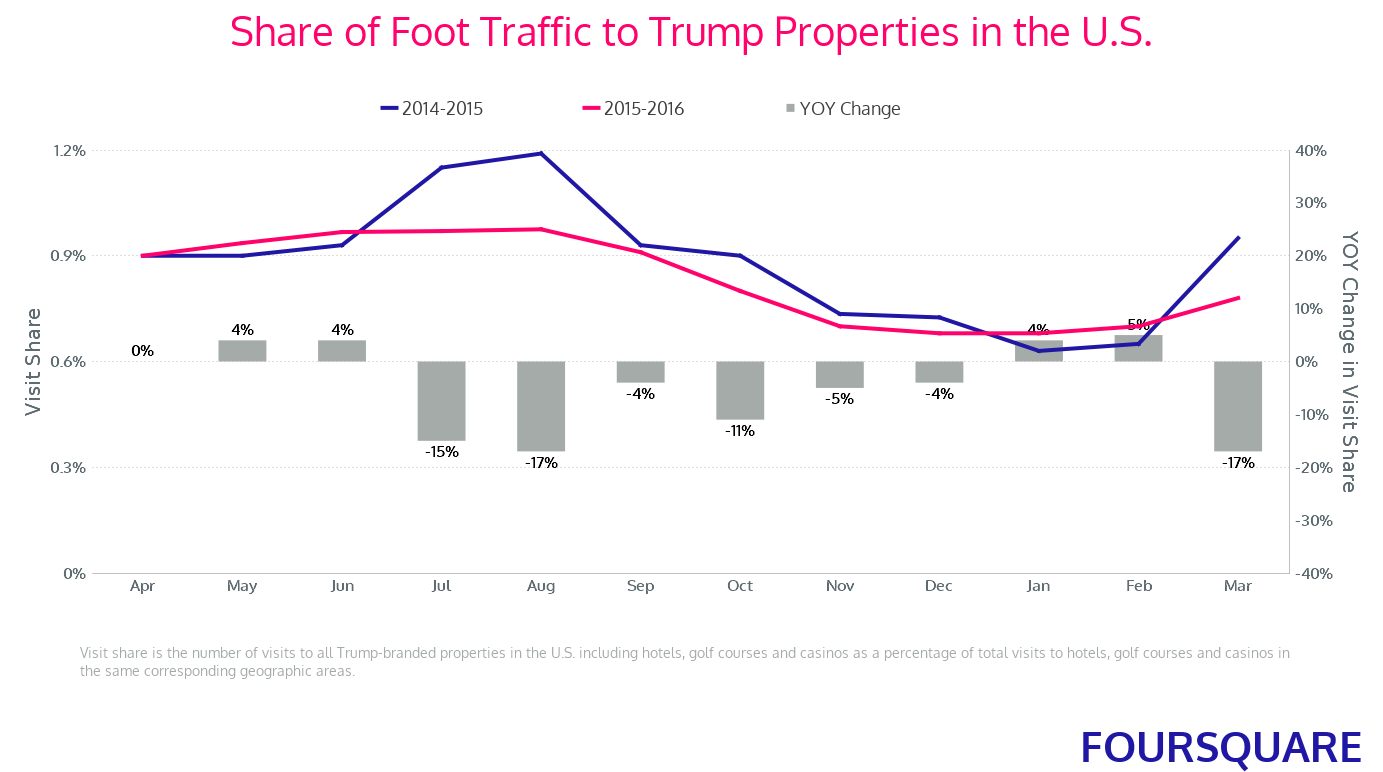 |
[#-- Note: the following datasets are not accurate, they approximate the vales from the original chart. --]
[#-- https://medium.com/foursquare-direct/how-the-trump-presidential-campaign-is-affecting-trump-businesses-c343178e3c03 --]

[#assign dataSet1 = [
  ['Month', '2014-2015', '2015-2016'],
  ['Apr', 0.009, 0.009],
  ['May', 0.009, 0.00936],
  ['Jun', 0.00930, 0.009672],
  ['Jul', 0.0115, 0.0097],
  ['Aug', 0.0119, 0.00975],
  ['Sep', 0.00930, 0.00910],
  ['Oct', 0.009, 0.008],
  ['Nov', 0.00735, 0.007],
  ['Dec', 0.00725, 0.0068],
  ['Jan', 0.0063, 0.0068],
  ['Feb', 0.0065, 0.0070],
  ['Mar', 0.0095, 0.0078]
] /]

[#assign dataSet2 = [
  ['Month', 'YOY Change'],
  ['Apr', 0.00],
  ['May', 0.04],
  ['Jun', 0.04],
  ['Jul', -0.15],
  ['Aug', -0.17],
  ['Sep', -0.04],
  ['Oct', -0.11],
  ['Nov', -0.05],
  ['Dec', -0.04],
  ['Jan', 0.04],
  ['Feb', 0.05],
  ['Mar', -0.17]
] /]

[#assign chartProperties = {
    'padding': [0, 10, 0, 10],
    'textAntiAlias': true,

    'title': 'Share of Foot Traffic to Trump Properties in the U.S.',
    'title.font': {'size': 40, 'file': '~/Documents/Oxygen/Oxygen-Regular.ttf'},
    'title.paint': '#ff026c',
    'title.padding': [5, 5, 35, 5],
    'title.horizontalAlignment': 'center',

    'subtitles': ['FOURSQUARE', 'Visit share is the number of visits to all Trump-branded properties in the U.S. including hotels, golf courses and casinos as a percentage of total visits to hotels, golf courses and casinos in the same corresponding geographic areas.'],

    'subtitle[0].horizontalAlignment': 'right',
    'subtitle[0].textAlignment': 'right',
    'subtitle[0].font': {'size': 42, 'weight': 'bold', 'file': '~/Documents/Oxygen/Oxygen-Bold.ttf'},
    'subtitle[0].padding': [40, 10, 0, 10],
    'subtitle[0].paint': '#2018a4',
    'subtitle[0].position': 'bottom',

    'subtitle[1].horizontalAlignment': 'left',
    'subtitle[1].textAlignment': 'left',
    'subtitle[1].font': {'size': 14, 'file': '~/Documents/Oxygen/Oxygen-Regular.ttf'},
    'subtitle[1].padding': [40, 70, 0, 70],
    'subtitle[1].paint': '#a5aba9',
    'subtitle[1].position': 'bottom',

    'legend.visible': true,
    'legend.position': 'top',
    'legend.verticalAlignment': 'top',
    'legend.frame': {'insets': [0, 0, 0, 0]},
    'legend.margin': [0, 0, 20, 0],
    'legend.itemLabelPadding': [5, 5, 5, 100],
    'legend.legendItemGraphicPadding': [0, 0, 0, 0],
    'legend.itemFont': {'size': 18, 'file': '~/Documents/Oxygen/Oxygen-Regular.ttf'},

    'plot.axisOffset': [0, 0, 0, 0],
    'plot.rangeGridlinesVisible': true,
    'plot.rangeGridlinePaint': '#bbbbbb',
    'plot.rangeGridlineStroke': {'width': 1.0, 'cap': 0, 'join': 2, 'miterlimit': 0.0, 'dash': [1.0, 3.0]},

    'plot.domainAxis.lowerMargin': 0.01,
    'plot.domainAxis.upperMargin': 0.01,
    'plot.domainAxis.tickLabelPaint': '#5e6c71',
    'plot.domainAxis.tickLabelFont': {'size': 14, 'weight': 'bold', 'file': '~/Documents/Oxygen/Oxygen-Regular.ttf'},
    'plot.domainAxis.tickMarksVisible': false,

    'plot.rangeAxis': ['org.jfree.chart.axis.NumberAxis', 'org.jfree.chart.axis.NumberAxis'],
    'plot.mapDatasetToRangeAxis':[0, 1],

    'plot.rangeAxis[0].axisLineVisible': false,
    'plot.rangeAxis[0].tickLabelPaint': '#5e6c71',
    'plot.rangeAxis[0].tickLabelFont': {'size': 14, 'weight': 'bold', 'file': '~/Documents/Oxygen/Oxygen-Regular.ttf'},
    'plot.rangeAxis[0].tickMarksVisible': false,
    'plot.rangeAxis[0].range': [0, 0.012],
    'plot.rangeAxis[0].tickUnit': {'size': 0.003},
    'plot.rangeAxis[0].numberFormatOverride': '0.#%',
    'plot.rangeAxis[0].label': 'Visit Share',
    'plot.rangeAxis[0].labelPaint': '#5e6c71',
    'plot.rangeAxis[0].labelFont': {'size': 20},

    'plot.rangeAxis[1].tickLabelFont': {'size': 14, 'weight': 'bold', 'file': '~/Documents/Oxygen/Oxygen-Regular.ttf'},
    'plot.rangeAxis[1].tickLabelPaint': '#5e6c71',
    'plot.rangeAxis[1].tickMarksVisible': false,
    'plot.rangeAxis[1].range': [-0.40, 0.40],
    'plot.rangeAxis[1].tickUnit': {'size': 0.10},
    'plot.rangeAxis[1].numberFormatOverride': '#.#%',
    'plot.rangeAxis[1].label': 'YOY Change in Visit Share',
    'plot.rangeAxis[1].labelPaint': '#5e6c71',
    'plot.rangeAxis[1].labelFont': {'size': 20},

    'plot.renderer': ['org.jfree.chart.renderer.category.LineAndShapeRenderer', 'org.jfree.chart.renderer.category.BarRenderer'],

    'plot.renderer[0].baseFillPaint': '#3366cc',
    'plot.renderer[0].drawOutlines': false,
    'plot.renderer[0].baseShapesVisible': false,
    'plot.renderer[0].baseLinesVisible': true,
    'plot.renderer[0].baseShapesFilled': false,
    'plot.renderer[0].useFillPaint': true,
    'plot.renderer[0].seriesStroke': [{'width': 4.0}, {'width': 4.0}],
    'plot.renderer[0].seriesPaint': ['#2018a4', '#ff026c'],

    'plot.renderer[1].seriesItemLabelGenerator': [{'labelFormat':'{2}', 'numberFormat':'#%'}],
    'plot.renderer[1].seriesItemLabelFont': [{'size': 14, 'weight': 'bold', 'file': '~/Documents/Oxygen/Oxygen-Regular.ttf'}],
    'plot.renderer[1].seriesItemLabelsVisible': [true],
    'plot.renderer[1].seriesPaint': ['#a5aba9'],
    'plot.renderer[1].maximumBarWidth': 0.04,
    'plot.renderer[1].drawBarOutline': false,
    'plot.renderer[1].shadowVisible': false,

    'plot.backgroundPaint': '',
    'plot.outlineVisible': false
} /]

<img src="[@jfreechart type='line' datasets=[dataSet1, dataSet2] properties=chartProperties width=1383 height=772 /]"/>In order to create a line chart that uses numbers on the domain axis, the jfreechart directive must be used with the following parameters:
Table 4.7. The jfreechart directive parameters for xy line charts
| Parameter | Value |
|---|---|
| type | xyline |
| dataset |
A sequence of the following form: [ [Heading , Series1 , ... Seriesn], [xValue1 , yValue11, ... yValuen1], ... [xValuek , yValue1k, ... yValuenk] ] where:
|
| datasets |
A sequence of the following form: [dataset1, dataset2, ... datasetn] where dataseti is a dataset defined according to the above format. This chart can use one dataset if the dataset parameter is used or multiple datasets if the datasets parameter is used. It doesn't accept datasets specified using both parameters at the same time. The datasets parameter is used by charts with multiple axes. |
| properties | The following properties are accepted:
|
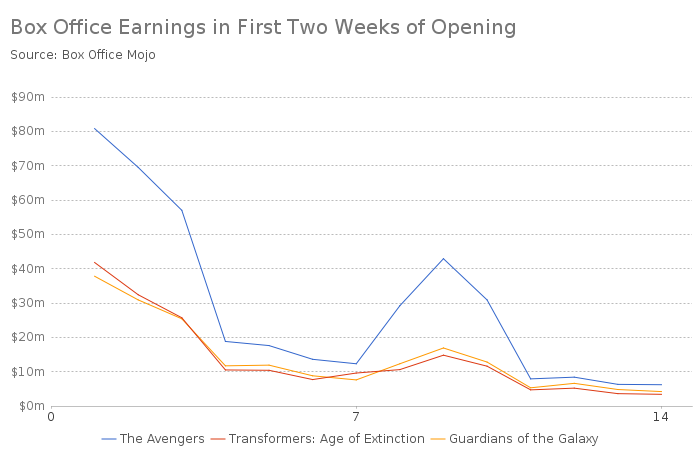
The following example creates a line chart to represent the box office earnings in first two weeks of opening for three movies.
[#--
http://www.boxofficemojo.com/movies/?page=daily&view=chart&id=avengers11.htm
http://www.boxofficemojo.com/movies/?page=daily&view=chart&id=transformers4.htm
http://www.boxofficemojo.com/movies/?page=daily&view=chart&id=marvel2014a.htm
--]

[#assign dataSet = [
 ['Day', 'The Avengers', 'Transformers: Age of Extinction',  'Guardians of the Galaxy'],
 [ 1, 80.8, 41.8, 37.8],
 [ 2, 69.5, 32.4, 30.9],
 [ 3,   57, 25.7, 25.4],
 [ 4, 18.8, 10.5, 11.7],
 [ 5, 17.6, 10.4, 11.9],
 [ 6, 13.6,  7.7,  8.8],
 [ 7, 12.3,  9.6,  7.6],
 [ 8, 29.2, 10.6, 12.3],
 [ 9, 42.9, 14.8, 16.9],
 [10, 30.9, 11.6, 12.8],
 [11,  7.9,  4.7,  5.3],
 [12,  8.4,  5.2,  6.6],
 [13,  6.3,  3.6,  4.8],
 [14,  6.2,  3.4,  4.2]
]/]

[#assign chartProperties = {
    'title': 'Box Office Earnings in First Two Weeks of Opening',
    'title.font': {'size': 20},
    'title.horizontalAlignment': 'left',
    'title.padding': [15, 10, 10, 5],
    'title.paint': '#777777',

    'subtitles': ['Source: Box Office Mojo'],
    'subtitle[0].horizontalAlignment': 'left',
    'subtitle[0].padding': [0, 10, 30, 10],
    'subtitle[0].font': {'size': 12},
    'subtitle[0].paint': '#555555',

    'legend.frame': {'insets': [0, 0, 0, 0]},
    'legend.visible': true,
    'legend.position': 'bottom',
    'legend.verticalAlignment': 'top',
    'legend.itemPaint': '#555555',

    'plot.axisOffset': [0, 0, 0, 0],
    'plot.rangeGridlinesVisible': true,
    'plot.rangeGridlinePaint': '#777777',

    'plot.domainAxis.tickUnit': {'size': 7},

    'plot.rangeAxis.axisLineVisible': false,
    'plot.rangeAxis.numberFormatOverride': '${"$"}#0m',
    'plot.rangeAxis.labelFont': {'size': 12},
    'plot.rangeAxis.labelPaint': '#777777',
    'plot.rangeAxis.tickLabelPaint': '#777777',
    'plot.rangeAxis.tickMarksVisible': false,
    'plot.rangeAxis.tickUnit': {'size': 10},
    'plot.rangeAxis.range': [0, 90],

    'plot.backgroundPaint': '',
    'plot.outlineVisible': false
} /]

<img src="[@jfreechart type='xyline' dataset=dataSet properties=chartProperties width=700 height=400 /]"/>
In order to create a line chart that uses dates/times on the domain axis, the jfreechart directive must be used with the following parameters:
Table 4.8. The jfreechart directive parameters for time series line charts
| Parameter | Value |
|---|---|
| type | timeseriesline |
| dataset |
A sequence of the following form: [ [Heading , Series1 , ... Seriesn], [xValue1 , yValue11, ... yValuen1], ... [xValuek , yValue1k, ... yValuenk] ] where:
|
| datasets |
A sequence of the following form: [dataset1, dataset2, ... datasetn] where dataseti is a dataset defined according to the above format. This chart can use one dataset if the dataset parameter is used or multiple datasets if the datasets parameter is used. It doesn't accept datasets specified using both parameters at the same time. The datasets parameter is used by charts with multiple axes. |
| properties | The following properties are accepted:
|
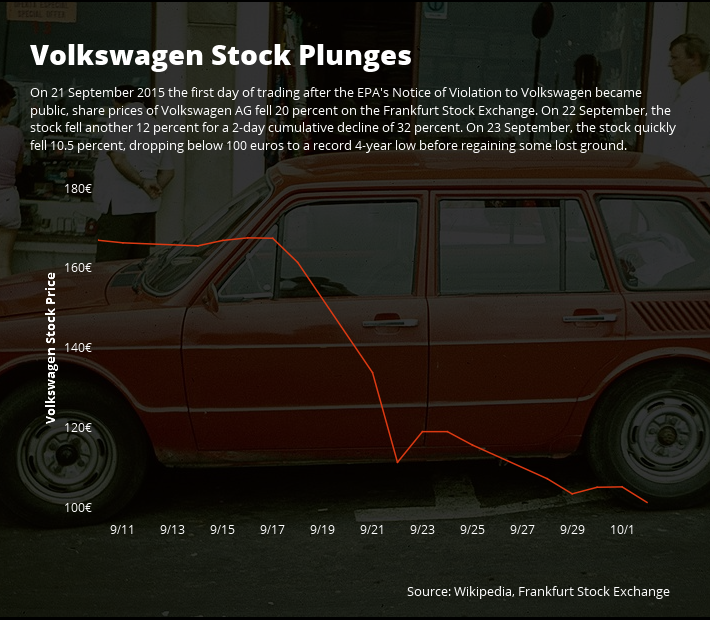
The following example creates a line chart that shows the evolution of the Volkswagen AG stock price after it admitted to cheating on U.S. air pollution tests for years.
This chart uses the Open Sans font and it expects to find its files in the folder ~/Documents/Open_Sans/.
[#--
https://en.wikipedia.org/wiki/Volkswagen_emissions_scandal#Stock_value
http://www.boerse-frankfurt.de/en/equities/volkswagen+ag+st+DE0007664005/price+turnover+history/historical+data
--]

[#assign dataSet = [
  ['Date', 'Price'],
  ['2015-09-01'?date.iso, 161.95],
  ['2015-09-02'?date.iso, 159.50],
  ['2015-09-03'?date.iso, 164.40],
  ['2015-09-04'?date.iso, 159.95],
  ['2015-09-07'?date.iso, 161.15],
  ['2015-09-08'?date.iso, 165.40],
  ['2015-09-09'?date.iso, 169.60],
  ['2015-09-10'?date.iso, 166.90],
  ['2015-09-11'?date.iso, 166.25],
  ['2015-09-14'?date.iso, 165.50],
  ['2015-09-15'?date.iso, 166.85],
  ['2015-09-16'?date.iso, 167.50],
  ['2015-09-17'?date.iso, 167.40],
  ['2015-09-18'?date.iso, 161.35],
  ['2015-09-21'?date.iso, 133.70],
  ['2015-09-22'?date.iso, 111.20],
  ['2015-09-23'?date.iso, 118.90],
  ['2015-09-24'?date.iso, 118.90],
  ['2015-09-25'?date.iso, 115.55],
  ['2015-09-28'?date.iso, 107.10],
  ['2015-09-29'?date.iso, 103.30],
  ['2015-09-30'?date.iso, 104.95],
  ['2015-10-01'?date.iso, 105.05],
  ['2015-10-02'?date.iso, 101.15]
] /]

[#assign chartProperties = {
    'backgroundImage': 'https://upload.wikimedia.org/wikipedia/commons/thumb/2/26/Volkswagen_Brasilia_TF.JPG/1024px-Volkswagen_Brasilia_TF.JPG',
    'backgroundImageAlignment': 0,
    'backgroundImageAlpha': 0.2,
    'backgroundPaint': '#000000',

    'borderPaint': '',
    'borderVisible': true,
    'padding': [30, 30, 20, 30],
    'borderStroke': {'width': 0.2},

    'title': 'Volkswagen Stock Plunges',
    'title.horizontalAlignment': 'left',
    'title.font': {'size': 28, 'file': '~/Documents/Open_Sans/OpenSans-ExtraBold.ttf'},
    'title.padding': [5, 0, 10, 0],
    'title.paint': '#ffffff',

    'subtitles': ['On 21 September 2015 the first day of trading after the EPA\'s Notice of Violation to Volkswagen became public, share prices of Volkswagen AG fell 20 percent on the Frankfurt Stock Exchange. On 22 September, the stock fell another 12 percent for a 2-day cumulative decline of 32 percent. On 23 September, the stock quickly fell 10.5 percent, dropping below 100 euros to a record 4-year low before regaining some lost ground.', 'Source: Wikipedia, Frankfurt Stock Exchange'],

    'subtitle[0].horizontalAlignment': 'left',
    'subtitle[0].font': {'size': 13, 'file': '~/Documents/Open_Sans/OpenSans-Regular.ttf'},
    'subtitle[0].textAlignment': 'left',
    'subtitle[0].padding': [0, 0, 30, 0],
    'subtitle[0].paint': '#ffffff',

    'subtitle[1].horizontalAlignment': 'right',
    'subtitle[1].font': {'size': 13, 'file': '~/Documents/Open_Sans/OpenSans-Regular.ttf'},
    'subtitle[1].padding': [40, 10, 0, 10],
    'subtitle[1].paint': '#ffffff',
    'subtitle[1].position': 'bottom',

    'legend.visible': false,

    'plot.axisOffset': [0, 0, 10, 0],
    'plot.backgroundPaint': '',
    'plot.outlineVisible': false,
    'plot.rangeGridlinesVisible': false,
    'plot.domainGridlinesVisible': false,

    'plot.renderer.baseLinesVisible': true,
    'plot.renderer.seriesStroke': [{'width': 1.5}],
    'plot.renderer.seriesPaint': ['#dc3912'],

    'plot.domainAxis.axisLineVisible': false,
    'plot.domainAxis.lowerMargin': 0.01,
    'plot.domainAxis.upperMargin': 0.01,
    'plot.domainAxis.tickMarksVisible': false,
    'plot.domainAxis.tickLabelPaint': '#ffffff',
    'plot.domainAxis.tickLabelFont': {'size': 12, 'file': '~/Documents/Open_Sans/OpenSans-Regular.ttf'},
    'plot.domainAxis.tickUnit': {'unitType': 'day', 'multiple': 2},
    'plot.domainAxis.dateFormatOverride': 'M/d',
    'plot.domainAxis.range': ['2015-09-10'?date.iso, '2015-10-03'?date.iso],

    'plot.rangeAxis.axisLineVisible': false,
    'plot.rangeAxis.label': 'Volkswagen Stock Price',
    'plot.rangeAxis.labelPaint': '#ffffff',
    'plot.rangeAxis.labelFont': {'size': 13, 'file': '~/Documents/Open_Sans/OpenSans-Bold.ttf'},
    'plot.rangeAxis.tickLabelFont': {'size': 12, 'file': '~/Documents/Open_Sans/OpenSans-Regular.ttf'},
    'plot.rangeAxis.tickLabelPaint': '#ffffff',
    'plot.rangeAxis.tickMarksVisible': false,
    'plot.rangeAxis.tickUnit': {'size': 20},
    'plot.rangeAxis.numberFormatOverride': '0€',
    'plot.rangeAxis.range': [100, 180]
} /]

<img src="[@jfreechart type='timeseriesline' dataset=dataSet properties=chartProperties width=710 height=620 /]"/>
A pie chart is a type of chart in which a circle is divided into sectors that each represent a proportion of the whole. Pie charts are used to make part-to-whole comparisons however they should be used only when a rough overview is enough because it's hard to make exact comparisons between sectors of similar sizes.
If you haven't used pie charts before, these resources explain them in more detail:
In order to create a pie chart, the jfreechart directive must be used with the following parameters:
Table 4.9. The jfreechart directive parameters for pie charts
| Parameter | Value |
|---|---|
| type | pie |
| dataset |
A sequence of the following form: [ [Section1 , Value1], ... [Sectionn , Valuen] ] where:
|
| properties | The following properties are accepted: |
The following example creates a pie chart that shows the growth of internet population between 2007 and 2012.
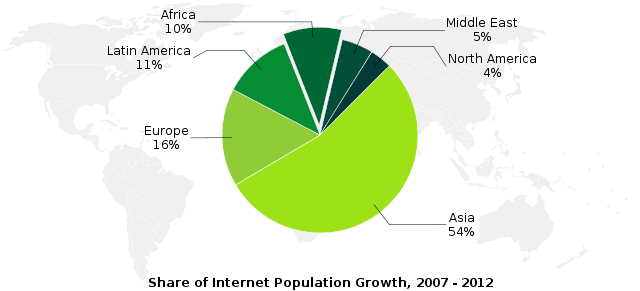
[#assign pieDataSet = [
    ['Asia',          53.8],
    ['Europe',        16.1],
    ['Latin America', 11.3],
    ['Africa',         9.6],
    ['Middle East',    5.2],
    ['North America',  3.6]
] /]

[#assign chartProperties = {
    'title': 'Share of Internet Population Growth, 2007 - 2012',
    'backgroundImage': 'https://upload.wikimedia.org/wikipedia/commons/thumb/f/fc/No_colonies_blank_world_map.png/640px-No_colonies_blank_world_map.png',

    'title.position': 'bottom',
    'title.font': {'size': 12, 'weight': 'bold'},

    'legend.visible': false,

    'plot.backgroundPaint': '',
    'plot.outlineVisible': false,
    'plot.shadowPaint': '',

    'plot.startAngle': 45,
    'plot.baseSectionOutlinePaint': '#ffffff',
    'plot.sectionPaint':['#9de219', '#90cc38', '#068c35', '#006634', '#004d38', '#033939'],
    'plot.explodePercent': [0, 0, 0, 0.1, 0, 0],

    'plot.labelGenerator': '{0}\n{2}',
    'plot.labelBackgroundPaint': '',
    'plot.labelShadowPaint': '',
    'plot.labelOutlinePaint': '',
    'plot.labelLinkStyle': 'standard'
} /]

<img src="[@jfreechart type='pie' dataset=pieDataSet properties=chartProperties width=640 height=291 /]"/>A ring chart is a pie chart with a hole in the center. In order to create a ring chart, the jfreechart directive must be used with the following parameters:
Table 4.10. The jfreechart directive parameters for ring charts
| Parameter | Value |
|---|---|
| type | ring |
| dataset |
A sequence of the following form: [ [Section1 , Value1], ... [Sectionn , Valuen] ] where:
|
| properties | The following properties are accepted: |
The following example creates a ring chart that shows the monthly expenses of a fictitious person.
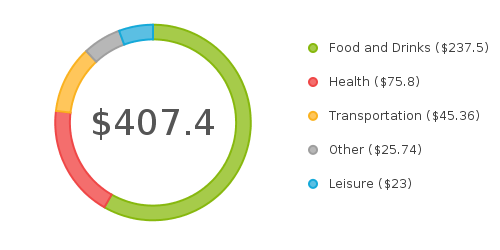
[#assign pieDataSet = [
    ['Food and Drinks', 237.5],
    ['Health',           75.8],
    ['Transportation',  45.36],
    ['Other',           25.74],
    ['Leisure',          23.0]
] /]

[#assign chartProperties = {
    'title.visible': false,

    'legend.visible': true,
    'legend.position': 'right',
    'legend.verticalAlignment': 'top',
    'legend.frame': {"insets": [0, 0, 0, 0]},
    'legend.margin': [30, 0, 0, 0],
    'legend.itemLabelPadding': [10, 10, 10, 10],
    'plot.legendLabelGenerator': '{0} (${"$"}{1})',

    'plot.backgroundPaint': '',
    'plot.outlineVisible': false,
    'plot.shadowPaint': '',

    'plot.baseSectionOutlineStroke': {'width': 2.0},
    'plot.sectionOutlinePaint': ['#87b80e', '#ef4747', '#fab220', '#9e9e9e', '#15a9d9'],
    'plot.sectionPaint':['#a6cb4a', '#f46e6d', '#ffc65b', '#b7b7b7', '#5bbfe3'],

    'plot.labelGenerator': '',

    'plot.centerTextMode': 'fixed',
    'plot.centerText': '$407.4',
    'plot.centerTextFont': {'size': 36},
    'plot.centerTextColor': '#555555',

    'plot.sectionDepth': 0.15,
    'plot.separatorsVisible': false
} /]

<img src="[@jfreechart type='ring' dataset=pieDataSet properties=chartProperties width=500 height=250 /]"/>Chart properties control the visual elements of a chart. All properties supported by the jfreechart directive are documented in this section. They are grouped by the major components of a chart (title, legend, plot, renderer, domain axis, range axis).
Properties have a name and a type. Their name is linked to the corresponding JFreeChart API method so you can read about the features they control. Here are a few properties and their corresponding JFreeChart methods:
-
The 'title' property maps to the JFreeChart.setTitle(String) method
-
The 'legend.visible' property maps to the JFreeChart.getLegend().setVisible(boolean) method
-
The 'plot.backgroundImage' property maps to the JFreeChart.getPlot().setBackgroundImage(Image) method
The type of a property defines the allowed values of a property. All types are documented in the following table. Property types are linked to the corresponding classes.
Property types that are followed by two brackets represent a sequence of elements of the specified type. For instance, boolean[] represents a sequence of boolean elements like [true, true, false, true], while Paint[] represents a sequence of colors like ['#ff0000', '#ffffff', '#00ff00']. These sequences are useful for configuring things like the colors of a pie chart (plot.sectionPaint).
Table 4.11. Property types
| Type | Values | Example |
|---|---|---|
| AreaRendererEndType | 'level', 'taper' or 'truncate' | 'plot.renderer.endType': 'level' |
| AxisLabelLocation | 'low end', 'middle' or 'high end' | 'plot.domainAxis.labelLocation': 'middle' |
| AxisLocation | 'top or left', 'top or right', 'bottom or left', 'bottom or right' | 'plot.domainAxisLocation': 'top or left' |
| BlockFrame | a hash with one or more of the following
keys:
|
'legend.frame': {'paint': '#000000', 'insets': [10, 10, 10, 10]} |
| boolean | true or false | 'title.visible': false |
| CategoryAnchor | 'start', 'middle' or 'end' | 'plot.domainGridlinePosition': 'middle' |
| CategoryItemLabelGenerator |
a hash with none or some of the following keys:
|
'plot.renderer.baseItemLabelGenerator': {'labelFormat':'{2}', 'numberFormat':'#%'} |
| CategoryItemRenderer |
a text with the fully qualified class name of the renderer |
'plot.renderer': 'org.jfree.chart.renderer.category.LineAndShapeRenderer' |
| CategorySeriesLabelGenerator |
a text that should use the {0} placeholder |
'plot.renderer.legendItemLabelGenerator': '{0}' |
| CenterTextMode | 'fixed', 'none' or 'value' | 'plot.centerTextMode': 'none' |
| Color |
Colors can be specified as texts in rgb, rgba or hexadecimal formats. If the text is empty it means no color. |
'plot.centerTextColor': '#ff0000' 'plot.centerTextColor': 'rgb(255, 0, 0)' 'plot.centerTextColor': 'rgba(255, 0, 0, 1.0)' 'plot.centerTextColor': '' |
| DatasetRenderingOrder | 'forward' or 'reverse' | 'plot.datasetRenderingOrder': 'forward' |
| Date | A date or time value. See the Freemarker docs for more details on how to convert a text to a date. | 'plot.domainAxis.maximumDate': '2015-01-01'?date.iso |
| DateFormat | See SimpleDateFormat for symbols that can be used to define the pattern. | 'plot.domainAxis.dateFormatOverride': 'MMM dd' |
| DateTickMarkPosition | 'start', 'middle' or 'end' | 'plot.domainAxis.tickMarkPosition': 'middle' |
| DateTickUnit | a hash with the following keys:
|
'plot.domainAxis.tickUnit': {'unitType': 'hour', 'multiple': 2} |
| DateTickUnitType | 'year', 'month', 'day', 'hour', 'minute', 'second', 'millisecond' | 'plot.domainAxis.tickUnit': {'unitType': 'hour', 'multiple': 2} |
| double | a number | 'title.width': 30 |
| HorizontalAlignment | 'left', 'right' or 'center' | 'legend.horizontalAlignment': 'center' |
| Image |
|
'backgroundImage': 'file://pathtofile/file.png' 'backgroundImage': 'http://www.somedomain.com/image.png' 'backgroundImage': 'data:image/png;base64,iVBORw...' |
| int | a number | 'title.maximumLinesToDisplay': 1 |
| ItemLabelAnchor |
'center', 'inside1', 'inside2', 'inside3', 'inside4', 'inside5', 'inside6', 'inside7', 'inside8', 'inside9', 'inside10', 'inside11', 'inside12', 'outside1', 'outside2', 'outside3', 'outside4', 'outside5', 'outside6', 'outside7', 'outside8', 'outside9', 'outside10', 'outside11', or 'outside12' See BarRenderer.calculateLabelAnchorPoint to understand how each anchor is used to calculate the coordinates. |
'plot.renderer.baseNegativeItemLabelPosition': ['inside9', 'center', 'center', 0] |
| ItemLabelPosition |
a sequence with four elements: [itemLabelAnchor, textAnchor, rotationAnchor, angle] where:
|
'plot.renderer.baseNegativeItemLabelPosition': ['inside9', 'center', 'center', 0] |
| float | a number | 'backgroundImageAlpha': 0.9 |
| Font | a hash with one or more of the following
keys:
|
'title.font': {'size': 20} 'title.font': {'name': 'sans-serif', 'size': 20, 'style': 'normal', 'weight': 'bold'} 'title.font': {'file': '/usr/share/fonts/truetype/freefont/FreeSans.ttf', 'size': 20} |
| Format | See DecimalFormat for symbols that can be used to define the pattern. | 'plot.centerTextFormatter': '0.000' |
| Locale | See Locale for symbols that can be used to define the pattern. | 'plot.domainAxis.locale': 'fr_FR' |
| NumberFormat | See DecimalFormat for symbols that can be used to define the pattern. | 'plot.rangeAxis.numberFormatOverride': '0.000' |
| NumberTickUnit | a hash with one or more of the following
keys:
|
'plot.rangeAxis.tickUnit': {'size': 50} 'plot.rangeAxis.tickUnit': {'size': 50, 'format': '#0.00', 'minorTickCount': 5} |
| Paint | see Color | 'title.paint': '#000000' |
| PieLabelLinkStyle | 'standard', 'cubic curve' or 'quad curve' | 'plot.labelLinkStyle': 'standard' |
| PieSectionLabelGenerator |
|
'plot.labelGenerator': '{0}' |
| PlotOrientation | 'vertical' or 'horizontal' | 'plot.orientation': 'horizontal' |
| Point2D | [x, y] | 'plot.quadrantOrigin': [0, 0] |
| Range |
a sequence with two numbers or two dates: [lower, upper] |
'plot.rangeAxis.defaultAutoRange': [0, 10] 'plot.domainAxis.range': ['10:30'?time.iso, '12:35'?time.iso] |
| RangeType | 'full', 'positive' or 'negative' | 'plot.rangeAxis.rangeType': 'full' |
| RectangleAnchor | 'top', 'top left', 'top right', 'center', 'left', 'right', 'bottom', 'bottom left', or 'bottom right' | 'legend.legendItemGraphicLocation': 'center' |
| RectangleEdge | 'top', 'left', 'bottom', or 'right' | 'legend.position': 'bottom' |
| RectangleInsets |
a sequence with four numbers: [top, left, bottom, right] |
'padding': [0, 0 , 0, 0] |
| Rotation | 'clockwise' or 'anticlockwise' | 'plot.direction': 'anticlockwise' |
| SeriesRenderingOrder | 'forward' or 'reverse' | 'plot.seriesRenderingOrder': 'forward' |
| Shape |
One of the following shapes (see examples for parameters): 'up-triangle', 'down-triangle', 'left-triangle', 'right-triangle', 'diamond', 'regular-cross', 'diagonal-cross', 'rectangle', 'ellipse' |
'plot.rangeAxis.upArrow': {'shape': 'up-triangle', 'size': 3} 'plot.rangeAxis.downArrow': {'shape': 'down-triangle', 'size': 3} 'plot.rangeAxis.leftArrow': {'shape': 'left-triangle', 'size': 3} 'plot.rangeAxis.rightArrow': {'shape': 'right-triangle', 'size': 3} 'plot.legendItemShape': {'shape':'diamond', 'size': 5} 'plot.legendItemShape': {'shape': 'regular-cross', 'length': 5, 'thickness': 1} 'plot.legendItemShape': {'shape': 'diagonal-cross', 'length': 5, 'thickness': 1} 'plot.legendItemShape': {'shape': 'rectangle', 'x': 0, 'y': 0, 'width': 5, 'height': 10} 'plot.legendItemShape': {'shape': 'ellipse', 'x': 0, 'y': 0, 'width': 10, 'height': 10}, |
| SortOrder | 'ascending' or 'descending' | 'legend.sortOrder': 'ascending' |
| String | a text | 'title': 'Title' |
| Stroke |
a hash with one or more of the following keys (click the type link for more details):
|
'borderStroke': {'width': 1.0} 'borderStroke': {'width': 1.0, 'cap': 0, 'join': 2, 'miterlimit': 0.0, 'dash': [2.0, 2.0], 'dash_phase': 0.0} |
| TextAnchor |
'top left', 'top center', 'top right', 'half ascent left', 'half ascent center', 'half ascent right', 'center left', 'center', 'center right', 'baseline left', 'baseline center', 'baseline right', 'bottom left', 'bottom center', or 'bottom right' |
'plot.renderer.baseNegativeItemLabelPosition': ['inside9', 'center', 'center', 0] |
| TimeZone |
See TimeZone for codes that can be used to define the timezone. |
'plot.domainAxis.timezone': 'GMT' |
| ValueAxis |
a text with the fully qualified class name of the axis |
'plot.rangeAxis': 'org.jfree.chart.axis.NumberAxis' |
| VerticalAlignment | 'top', 'center' or 'bottom' | 'legend.verticalAlignment': 'center' |
| XYItemLabelGenerator |
|
'plot.renderer.baseItemLabelGenerator': '{2}' |
| XYItemRenderer |
a text with the fully qualified class name of the renderer |
'plot.renderer': 'org.jfree.chart.renderer.xy.XYLineAndShapeRenderer' |
| XYSeriesLabelGenerator |
a text that should use the {0} placeholder |
'plot.renderer.legendItemLabelGenerator': '{0}' |
The following properties are available for all types of charts.
Table 4.12. JFreeChart properties
| Name | Type | Example |
|---|---|---|
| antiAlias | boolean | 'antiAlias': true |
| backgroundImage | Image | 'backgroundImage': 'http://www.somedomain.com/image.png' |
| backgroundImageAlignment | int |
The number must be the value of one of the align constants. The value zero stands for center alignment.
'backgroundImageAlignment': 0 |
| backgroundImageAlpha | float | 'backgroundImageAlpha': 0.9 |
| backgroundPaint | Paint | 'backgroundPaint': '' |
| borderPaint | Paint | 'borderPaint': '#ff0000' |
| borderStroke | Stroke | 'borderStroke': {'width': 1.0} |
| borderVisible | boolean | 'borderVisible': true |
| padding | RectangleInsets | 'padding': [0, 0 , 0, 0] |
| subtitles | List |
'subtitles': ['Source: Box Office Mojo'] See the title section below for details on how to configure the properties of a subtitle. For instance, to change the font of the first subtitle use the 'subtitle[0].font' property. |
| textAntiAlias | boolean | 'textAntiAlias': true |
| title | String | 'title': 'Title' |
The following properties configure the title and the subtitles of all types of charts.
To access the properties of a subtitle, use subtitle[index] (where index starts at zero). For instance, to access the font property of the first subtitle use 'subtitle[0].font'.
Table 4.13. Title properties
| Name | Type | Example |
|---|---|---|
| title.backgroundPaint | Paint | 'title.backgroundPaint': '' |
| title.expandToFitSpace | boolean | 'title.expandToFitSpace': true |
| title.font | Font | 'title.font': {'size': 20} |
| title.frame | BlockFrame | 'title.frame': {"insets": [10, 10, 10, 10]} |
| title.height | double | 'title.height': 30 |
| title.horizontalAlignment | HorizontalAlignment | 'title.horizontalAlignment': 'center' |
| title.margin | RectangleInsets | 'title.margin': [0, 0, 0, 0] |
| title.maximumLinesToDisplay | int | 'title.maximumLinesToDisplay': 1 |
| title.padding | RectangleInsets | 'title.padding': [10, 10, 10, 10] |
| title.paint | Paint | 'title.paint': '#000000' |
| title.position | RectangleEdge | 'title.position': 'top' |
| title.text | String |
'title.text': 'Title' same as 'title': 'Title'. |
| title.textAlignment | HorizontalAlignment | 'title.textAlignment': 'left' |
| title.verticalAlignment | VerticalAlignment | 'title.verticalAlignment': 'center' |
| title.visible | boolean | 'title.visible': false |
| title.width | double | 'title.width': 30 |
The following properties configure the legend of a chart and they are available for all types of charts.
Table 4.14. LegendTitle properties
| Name | Type | Example |
|---|---|---|
| legend.backgroundPaint | Paint | 'legend.backgroundPaint': '' |
| legend.frame | BlockFrame | 'legend.frame': {"insets": [10, 10, 10, 10]} |
| legend.height | double | 'legend.height': 30 |
| legend.horizontalAlignment | HorizontalAlignment | 'legend.horizontalAlignment': 'center' |
| legend.itemFont | Font | 'legend.itemFont': {'size': 20} |
| legend.itemLabelPadding | RectangleInsets | 'legend.itemLabelPadding': [10, 10, 10, 10] |
| legend.itemPaint | Paint | 'legend.itemPaint': '#000000' |
| legend.legendItemGraphicAnchor | RectangleAnchor | 'legend.legendItemGraphicAnchor': 'center' |
| legend.legendItemGraphicEdge | RectangleEdge | 'legend.legendItemGraphicEdge': 'left' |
| legend.legendItemGraphicLocation | RectangleAnchor | 'legend.legendItemGraphicLocation': 'center' |
| legend.legendItemGraphicPadding | RectangleInsets | 'legend.legendItemGraphicPadding': [0, 0, 0, 0] |
| legend.margin | RectangleInsets | 'legend.margin': [0, 0, 0, 0] |
| legend.padding | RectangleInsets | 'legend.padding': [10, 10, 10, 10] |
| legend.position | RectangleEdge | 'legend.position': 'bottom' |
| legend.sortOrder | SortOrder | 'legend.sortOrder': 'ascending' |
| legend.verticalAlignment | VerticalAlignment | 'legend.verticalAlignment': 'center' |
| legend.visible | boolean | 'legend.visible': false |
| legend.width | double | 'legend.width': 30 |
The following properties are common to all charts. Each chart uses a specialized plot that has specific properties. For instance, pie charts use a PiePlot that has these basic properties and a few more (documented below).
Table 4.15. Plot properties
| Name | Type | Example |
|---|---|---|
| plot.backgroundAlpha | float | 'plot.backgroundAlpha': 0.9 |
| plot.backgroundImage | Image | 'plot.backgroundImage': 'http://www.somedomain.com/image.png' |
| plot.backgroundImageAlignment | int |
The number must be the value of one of the align constants. The value zero stands for center alignment.
'plot.backgroundImageAlignment': 0 |
| plot.backgroundImageAlpha | float | 'plot.backgroundImageAlpha': 0.9 |
| plot.backgroundPaint | Paint | 'plot.backgroundPaint': '#ff0000' |
| plot.foregroundAlpha | float | 'plot.foregroundAlpha': 1.0 |
| plot.noDataMessage | String | 'plot.noDataMessage': 'No data available' |
| plot.noDataMessageFont | Font | 'plot.noDataMessageFont': {'size': 10} |
| plot.noDataMessagePaint | Paint | 'plot.noDataMessagePaint': '#ff0000' |
| plot.outlinePaint | Paint | 'plot.outlinePaint': '#ffffff' |
| plot.outlineStroke | Stroke | 'plot.outlineStroke': {'width': 1.0} |
| plot.outlineVisible | boolean | 'plot.outlineVisible': true |
The following properties are common to pie charts and ring charts.
Table 4.16. PiePlot properties
| Name | Type | Example |
|---|---|---|
| plot.autoPopulateSectionOutlinePaint | boolean | 'plot.autoPopulateSectionOutlinePaint': true |
| plot.autoPopulateSectionOutlineStroke | boolean | 'plot.autoPopulateSectionOutlineStroke': true |
| plot.autoPopulateSectionPaint | boolean | 'plot.autoPopulateSectionPaint': true |
| plot.baseSectionOutlinePaint | Paint | 'plot.baseSectionOutlinePaint': '#ffffff' |
| plot.baseSectionOutlineStroke | Stroke | 'plot.baseSectionOutlineStroke': {'width': 1.0} |
| plot.baseSectionPaint | Paint | 'plot.baseSectionPaint': '#ffffff' |
| plot.circular | boolean | 'plot.circular': true |
| plot.direction | Rotation | 'plot.direction': 'anticlockwise' |
| plot.explodePercent | double[] | 'plot.explodePercent': [0.10,0,0] |
| plot.ignoreNullValues | boolean | 'plot.ignoreNullValues': true |
| plot.ignoreZeroValues | boolean | 'plot.ignoreZeroValues': true |
| plot.interiorGap | double | 'plot.interiorGap': 0.1 |
| plot.labelBackgroundPaint | Paint | 'plot.labelBackgroundPaint': '#ffffff' |
| plot.labelFont | Font | 'plot.labelFont': {'size': 12} |
| plot.labelGap | double | 'plot.labelGap': 0.1 |
| plot.labelGenerator | PieSectionLabelGenerator | 'plot.labelGenerator': '{0}' |
| plot.labelLinkMargin | double | 'plot.labelLinkMargin': 5 |
| plot.labelLinkPaint | Paint | 'plot.labelLinkPaint': '#ffffff' |
| plot.labelLinkStroke | Stroke | 'plot.labelLinkStroke': {'width': 1.0} |
| plot.labelLinkStyle | PieLabelLinkStyle | 'plot.labelLinkStyle': 'standard' |
| plot.labelLinksVisible | boolean | 'plot.labelLinksVisible': true |
| plot.labelOutlinePaint | Paint | 'plot.labelOutlinePaint': '#ffffff' |
| plot.labelOutlineStroke | Stroke | 'plot.labelOutlineStroke': {'width': 1.0} |
| plot.labelPadding | RectangleInsets | 'plot.labelPadding': [10, 10, 10, 10] |
| plot.labelPaint | Paint | 'plot.labelPaint': '#ffffff' |
| plot.labelShadowPaint | Paint | 'plot.labelShadowPaint': '#000000' |
| plot.legendItemShape | Shape | 'plot.legendItemShape': {'shape':'diamond', 'size': 5} |
| plot.legendLabelGenerator | PieSectionLabelGenerator | 'plot.legendLabelGenerator': '{0}' |
| plot.maximumLabelWidth | double | 'plot.maximumLabelWidth': 0.20 |
| plot.minimumArcAngleToDraw | double | 'plot.minimumArcAngleToDraw': 5 |
| plot.sectionOutlinePaint | Paint[] | 'plot.sectionOutlinePaint': ['#ffffff','#ffffff'] |
| plot.sectionOutlineStroke | Stroke[] | 'plot.sectionOutlineStroke': [{'width': 1.0},{'width': 1.0}] |
| plot.sectionOutlinesVisible | boolean | 'plot.sectionOutlinesVisible': true |
| plot.sectionPaint | Paint[] | 'plot.sectionPaint': ['#ffffff','#ffffff'] |
| plot.shadowPaint | Paint | 'plot.shadowPaint': '#000000' |
| plot.shadowXOffset | double | 'plot.shadowXOffset': 2 |
| plot.shadowYOffset | double | 'plot.shadowYOffset': 2 |
| plot.simpleLabelOffset | RectangleInsets | 'plot.simpleLabelOffset': [1, 1, 1, 1] |
| plot.simpleLabels | boolean | 'plot.simpleLabels': true |
| plot.startAngle | double |
Angle value is expressed in degrees. 'plot.startAngle': 90 |
The following properties are specific to ring charts.
Table 4.17. RingPlot properties
| Name | Type | Example |
|---|---|---|
| plot.centerText | String |
Use this if 'plot.centerTextMode' is set to 'fixed'. 'plot.centerTextMode': 'fixed' 'plot.centerText': 'Text' |
| plot.centerTextColor | Color | 'plot.centerTextColor': '#222222' |
| plot.centerTextFormatter | Format |
Use this if 'plot.centerTextMode' is set to 'value'. It formats the value of the first item from the dataset. 'plot.centerTextMode': 'value' 'plot.centerTextFormatter': '0.000' |
| plot.centerTextFont | Font | 'plot.centerTextFont': {'size': 20} |
| plot.centerTextMode | CenterTextMode |
'plot.centerTextMode': 'none' 'plot.centerTextMode': 'value' 'plot.centerTextMode': 'fixed' |
| plot.innerSeparatorExtension | double | 'plot.innerSeparatorExtension': 0.50 |
| plot.outerSeparatorExtension | double | 'plot.outerSeparatorExtension': 0.50 |
| plot.sectionDepth | double | 'plot.sectionDepth': 0.45 |
| plot.separatorPaint | Paint | 'plot.separatorPaint': '#ff0000' |
| plot.separatorStroke | Stroke | 'plot.separatorStroke': '' |
| plot.separatorsVisible | boolean | 'plot.separatorsVisible': true |
The following properties are common to charts that use a category dataset (with texts on the domain axis).
Table 4.18. CategoryPlot properties
| Name | Type | Example |
|---|---|---|
| plot.anchorValue | double | 'plot.anchorValue': 10 |
| plot.axisOffset | RectangleInsets | 'plot.axisOffset': [0, 0, 0, 0] |
| plot.columnRenderingOrder | SortOrder | 'plot.columnRenderingOrder': 'ascending' |
| plot.crosshairDatasetIndex | int | 'plot.crosshairDatasetIndex': 0 |
| plot.datasetRenderingOrder | DatasetRenderingOrder | 'plot.datasetRenderingOrder': 'forward' |
| plot.domainAxisLocation | AxisLocation | 'plot.domainAxisLocation': 'bottom or right' |
| plot.domainCrosshairPaint | Paint | 'plot.domainCrosshairPaint': '#ff0000' |
| plot.domainCrosshairStroke | Stroke | 'plot.domainCrosshairStroke': {'width': 1.0} |
| plot.domainCrosshairVisible | boolean | 'plot.domainCrosshairVisible': true |
| plot.domainGridlinePaint | Paint | 'plot.domainGridlinePaint': '#ffffff' |
| plot.domainGridlinePosition | CategoryAnchor | 'plot.domainGridlinePosition': 'middle' |
| plot.domainGridlineStroke | Stroke | 'plot.domainGridlineStroke': {'width': 1.0} |
| plot.domainGridlinesVisible | boolean | 'plot.domainGridlinesVisible': true |
| plot.drawSharedDomainAxis | boolean | 'plot.drawSharedDomainAxis': true |
| plot.mapDatasetToRangeAxis | int[] |
The number of parameters depends on the number of datasets set on the chart. The following example is for a chart with two datasets and two range axes. 'plot.mapDatasetToRangeAxis': [0, 1] |
| plot.orientation | PlotOrientation | 'plot.orientation': 'horizontal' |
| plot.renderer | CategoryItemRenderer | 'plot.renderer': 'org.jfree.chart.renderer.category.LineAndShapeRenderer' |
| plot.rangeAxis | ValueAxis | 'plot.rangeAxis': 'org.jfree.chart.axis.NumberAxis' |
| plot.rangeAxisLocation | AxisLocation | 'plot.rangeAxisLocation': 'top or left' |
| plot.rangeCrosshairLockedOnData | boolean | 'plot.rangeCrosshairLockedOnData': true |
| plot.rangeCrosshairPaint | Paint | 'plot.rangeCrosshairPaint': '#ffffff' |
| plot.rangeCrosshairStroke | Stroke | 'plot.rangeCrosshairStroke': {'width': 1.0} |
| plot.rangeCrosshairValue | double | 'plot.rangeCrosshairValue': 5 |
| plot.rangeCrosshairVisible | boolean | 'plot.rangeCrosshairVisible': true |
| plot.rangeGridlinePaint | Paint | 'plot.rangeGridlinePaint': '#ffffff' |
| plot.rangeGridlineStroke | Stroke | 'plot.rangeGridlineStroke': {'width': 1.0} |
| plot.rangeGridlinesVisible | boolean | 'plot.rangeGridlinesVisible': true |
| plot.rangeMinorGridlinePaint | Paint | 'plot.rangeMinorGridlinePaint': '#ffffff' |
| plot.rangeMinorGridlineStroke | Stroke | 'plot.rangeMinorGridlineStroke': {'width': 1.0} |
| plot.rangeMinorGridlinesVisible | boolean | 'plot.rangeMinorGridlinesVisible': true |
| plot.rangePannable | boolean | 'plot.rangePannable': true |
| plot.rangeZeroBaselinePaint | Paint | 'plot.rangeZeroBaselinePaint': '#ffffff' |
| plot.rangeZeroBaselineStroke | Stroke | 'plot.rangeZeroBaselineStroke': {'width': 1.0} |
| plot.rangeZeroBaselineVisible | boolean | 'plot.rangeZeroBaselineVisible': true |
| plot.rowRenderingOrder | SortOrder | 'plot.rowRenderingOrder': 'ascending' |
The following properties are common to charts that use an xy dataset (with dates or numbers on the domain axis). Please note that range and domain markers are not supported.
Table 4.19. XYPlot properties
| Name | Type | Example |
|---|---|---|
| plot.axisOffset | RectangleInsets | 'plot.axisOffset': [0, 0, 0, 0] |
| plot.datasetRenderingOrder | DatasetRenderingOrder | 'plot.datasetRenderingOrder': 'forward' |
| plot.domainAxisLocation | AxisLocation | 'plot.domainAxisLocation': 'bottom or right' |
| plot.domainCrosshairLockedOnData | boolean | 'plot.domainCrosshairLockedOnData': true |
| plot.domainCrosshairPaint | Paint | 'plot.domainCrosshairPaint': '#ff0000' |
| plot.domainCrosshairStroke | Stroke | 'plot.domainCrosshairStroke': {'width': 1.0} |
| plot.domainCrosshairValue | double | 'plot.domainCrosshairValue': 5 |
| plot.domainCrosshairVisible | boolean | 'plot.domainCrosshairVisible': true |
| plot.domainGridlinePaint | Paint | 'plot.domainGridlinePaint': '#ffffff' |
| plot.domainGridlineStroke | Stroke | 'plot.domainGridlineStroke': {'width': 1.0} |
| plot.domainGridlinesVisible | boolean | 'plot.domainGridlinesVisible': true |
| plot.domainMinorGridlinePaint | Paint | 'plot.domainMinorGridlinePaint': '#ffffff' |
| plot.domainMinorGridlineStroke | Stroke | 'plot.domainMinorGridlineStroke': {'width': 1.0} |
| plot.domainMinorGridlinesVisible | boolean | 'plot.domainMinorGridlinesVisible': true |
| plot.domainPannable | boolean | 'plot.domainPannable': true |
| plot.domainTickBandPaint | Paint | 'plot.domainTickBandPaint': '#ff0000' |
| plot.domainZeroBaselinePaint | Paint | 'plot.domainZeroBaselinePaint': '#ffffff' |
| plot.domainZeroBaselineStroke | Stroke | 'plot.domainZeroBaselineStroke': {'width': 1.0} |
| plot.domainZeroBaselineVisible | boolean | 'plot.domainZeroBaselineVisible': true |
| plot.mapDatasetToRangeAxis | int[] |
The number of parameters depends on the number of datasets set on the chart. The following example is for a chart with two datasets and two range axes. 'plot.mapDatasetToRangeAxis': [0, 1] |
| plot.orientation | PlotOrientation | 'plot.orientation': 'horizontal' |
| plot.quadrantOrigin | Point2D | 'plot.quadrantOrigin': [0, 0] |
| plot.quadrantPaint | Paint[] | 'plot.quadrantPaint': ['#ff0000', '#00ff00', '#0000ff'] |
| plot.renderer | XYItemRenderer | 'plot.renderer': 'org.jfree.chart.renderer.xy.XYLineAndShapeRenderer ' |
| plot.rangeAxis | ValueAxis | 'plot.rangeAxis': 'org.jfree.chart.axis.NumberAxis' |
| plot.rangeAxisLocation | AxisLocation | 'plot.rangeAxisLocation': 'top or left' |
| plot.rangeCrosshairLockedOnData | boolean | 'plot.rangeCrosshairLockedOnData': true |
| plot.rangeCrosshairPaint | Paint | 'plot.rangeCrosshairPaint': '#ffffff' |
| plot.rangeCrosshairStroke | Stroke | 'plot.rangeCrosshairStroke': {'width': 1.0} |
| plot.rangeCrosshairValue | double | 'plot.rangeCrosshairValue': 5 |
| plot.rangeCrosshairVisible | boolean | 'plot.rangeCrosshairVisible': true |
| plot.rangeGridlinePaint | Paint | 'plot.rangeGridlinePaint': '#ffffff' |
| plot.rangeGridlineStroke | Stroke | 'plot.rangeGridlineStroke': {'width': 1.0} |
| plot.rangeGridlinesVisible | boolean | 'plot.rangeGridlinesVisible': true |
| plot.rangeMinorGridlinePaint | Paint | 'plot.rangeMinorGridlinePaint': '#ffffff' |
| plot.rangeMinorGridlineStroke | Stroke | 'plot.rangeMinorGridlineStroke': {'width': 1.0} |
| plot.rangeMinorGridlinesVisible | boolean | 'plot.rangeMinorGridlinesVisible': true |
| plot.rangePannable | boolean | 'plot.rangePannable': true |
| plot.rangeTickBandPaint | Paint | 'plot.rangeTickBandPaint': '#ff0000' |
| plot.rangeZeroBaselinePaint | Paint | 'plot.rangeZeroBaselinePaint': '#ffffff' |
| plot.rangeZeroBaselineStroke | Stroke | 'plot.rangeZeroBaselineStroke': {'width': 1.0} |
| plot.rangeZeroBaselineVisible | boolean | 'plot.rangeZeroBaselineVisible': true |
| plot.seriesRenderingOrder | SeriesRenderingOrder | 'plot.seriesRenderingOrder': 'forward' |
The following properties are common to all charts. Each chart uses a specialized renderer that has specific properties. Renderers control the appearance of a chart.
Table 4.20. AbstractRenderer properties
| Name | Type | Example |
|---|---|---|
| plot.renderer.autoPopulateSeriesFillPaint | boolean | 'plot.renderer.autoPopulateSeriesFillPaint': true |
| plot.renderer.autoPopulateSeriesOutlinePaint | boolean | 'plot.renderer.autoPopulateSeriesOutlinePaint': true |
| plot.renderer.autoPopulateSeriesOutlineStroke | boolean | 'plot.renderer.autoPopulateSeriesOutlineStroke': true |
| plot.renderer.autoPopulateSeriesPaint | boolean | 'plot.renderer.autoPopulateSeriesPaint': true |
| plot.renderer.autoPopulateSeriesShape | boolean | 'plot.renderer.autoPopulateSeriesShape': true |
| plot.renderer.autoPopulateSeriesStroke | boolean | 'plot.renderer.autoPopulateSeriesStroke': true |
| plot.renderer.baseCreateEntities | boolean | 'plot.renderer.baseCreateEntities': true |
| plot.renderer.baseFillPaint | Paint | 'plot.renderer.baseFillPaint': '#ffffff' |
| plot.renderer.baseItemLabelFont | Font | 'plot.renderer.baseItemLabelFont': {'size': 10} |
| plot.renderer.baseItemLabelPaint | Paint | 'plot.renderer.baseItemLabelPaint': '#ffffff' |
| plot.renderer.baseItemLabelsVisible | boolean | 'plot.renderer.baseItemLabelsVisible': true |
| plot.renderer.baseLegendShape | Shape | 'plot.renderer.baseLegendShape': {'shape': 'regular-cross', 'length': 5, 'thickness': 1} |
| plot.renderer.baseLegendTextFont | Font | 'plot.renderer.baseLegendTextFont': {'size': 10} |
| plot.renderer.baseLegendTextPaint | Paint | 'plot.renderer.baseLegendTextPaint': '#ffffff' |
| plot.renderer.baseNegativeItemLabelPosition | ItemLabelPosition | 'plot.renderer.baseNegativeItemLabelPosition': ['inside9', 'center', 'center', 0] |
| plot.renderer.baseOutlinePaint | Paint | 'plot.renderer.baseOutlinePaint': '#ffffff' |
| plot.renderer.baseOutlineStroke | Stroke | 'plot.renderer.baseOutlineStroke': {'width': 1.0} |
| plot.renderer.basePaint | Paint | 'plot.renderer.basePaint': '#ffffff' |
| plot.renderer.basePositiveItemLabelPosition | ItemLabelPosition | 'plot.renderer.basePositiveItemLabelPosition': ['inside1', 'center', 'center', 0] |
| plot.renderer.baseSeriesVisible | boolean | 'plot.renderer.baseSeriesVisible': true |
| plot.renderer.baseSeriesVisibleInLegend | boolean | 'plot.renderer.baseSeriesVisibleInLegend': true |
| plot.renderer.baseShape | Shape | 'plot.renderer.baseShape': {'shape': 'diagonal-cross', 'length': 5, 'thickness': 1} |
| plot.renderer.baseStroke | Stroke | 'plot.renderer.baseStroke': {'width': 1.0} |
| plot.renderer.dataBoundsIncludesVisibleSeriesOnly | boolean | 'plot.renderer.dataBoundsIncludesVisibleSeriesOnly': true |
| plot.renderer.defaultEntityRadius | int | 'plot.renderer.defaultEntityRadius': 5 |
| plot.renderer.itemLabelAnchorOffset | double | 'plot.renderer.itemLabelAnchorOffset': 10 |
| plot.renderer.itemLabelFont | Font | 'plot.renderer.itemLabelFont': {'size': 10} |
| plot.renderer.itemLabelPaint | Paint | 'plot.renderer.itemLabelPaint': '#ffffff' |
| plot.renderer.itemLabelsVisible | boolean | 'plot.renderer.itemLabelsVisible': true |
| plot.renderer.legendShape | Shape[] | 'plot.renderer.legendShape': [{'shape': 'regular-cross', 'length': 5, 'thickness': 1},{'shape': 'diagonal-cross', 'length': 5, 'thickness': 1}] |
| plot.renderer.legendTextFont | Font[] | 'plot.renderer.legendTextFont': [{'size': 10}] |
| plot.renderer.legendTextPaint | Paint[] | 'plot.renderer.legendTextPaint': ['#ffffff'] |
| plot.renderer.seriesCreateEntities | Boolean[] | 'plot.renderer.seriesCreateEntities': [true,true,true] |
| plot.renderer.seriesFillPaint | Paint[] | 'plot.renderer.seriesFillPaint': ['#ffffff'] |
| plot.renderer.seriesItemLabelFont | Font[] | 'plot.renderer.seriesItemLabelFont': [{'size': 10}] |
| plot.renderer.seriesItemLabelPaint | Paint[] | 'plot.renderer.seriesItemLabelPaint': ['#ffffff'] |
| plot.renderer.seriesItemLabelsVisible | boolean[] | 'plot.renderer.seriesItemLabelsVisible': [true,true,true] |
| plot.renderer.seriesNegativeItemLabelPosition | ItemLabelPosition[] | 'plot.renderer.seriesNegativeItemLabelPosition': [['inside9', 'center', 'center', 0]] |
| plot.renderer.seriesOutlinePaint | Paint[] | 'plot.renderer.seriesOutlinePaint': ['#ffffff'] |
| plot.renderer.seriesOutlineStroke | Stroke[] | 'plot.renderer.seriesOutlineStroke': [{'width': 1.0}] |
| plot.renderer.seriesPaint | Paint[] | 'plot.renderer.seriesPaint': ['#ffffff'] |
| plot.renderer.seriesPositiveItemLabelPosition | ItemLabelPosition[] | 'plot.renderer.seriesPositiveItemLabelPosition': [['inside9', 'center', 'center', 0]] |
| plot.renderer.seriesShape | Shape[] | 'plot.renderer.seriesShape': [{'shape': 'regular-cross', 'length': 5, 'thickness': 1},{'shape': 'diagonal-cross', 'length': 5, 'thickness': 1}] |
| plot.renderer.seriesStroke | Stroke[] | 'plot.renderer.seriesStroke': [{'width': 1.0}] |
| plot.renderer.seriesVisible | Boolean[] | 'plot.renderer.seriesVisible': [true,true,true] |
| plot.renderer.seriesVisibleInLegend | Boolean[] | 'plot.renderer.seriesVisibleInLegend': [true,true,true] |
The following properties are specific to charts that use texts on the domain axis.
Table 4.21. AbstractCategoryItemRenderer properties
| Name | Type | Example |
|---|---|---|
| plot.renderer.baseItemLabelGenerator | CategoryItemLabelGenerator | 'plot.renderer.baseItemLabelGenerator': {'labelFormat':'{2}'} |
| plot.renderer.legendItemLabelGenerator | CategorySeriesLabelGenerator | 'plot.renderer.legendItemLabelGenerator': '{0}' |
| plot.renderer.seriesItemLabelGenerator | CategoryItemLabelGenerator[] | 'plot.renderer.seriesItemLabelGenerator': [{'labelFormat':'{2}'}, {'labelFormat':'{2}'}] |
The following properties are specific to bar charts that use texts on the domain axis.
Table 4.22. BarRenderer properties
| Name | Type | Example |
|---|---|---|
| plot.renderer.base | double | 'plot.renderer.base': 0 |
| plot.renderer.drawBarOutline | boolean | 'plot.renderer.drawBarOutline': true |
| plot.renderer.includeBaseInRange | boolean | 'plot.renderer.includeBaseInRange': true |
| plot.renderer.itemMargin | double | 'plot.renderer.itemMargin': 0.05 |
| plot.renderer.maximumBarWidth | double | 'plot.renderer.maximumBarWidth': 0.35 |
| plot.renderer.minimumBarLength | double | 'plot.renderer.minimumBarLength': 0 |
| plot.renderer.negativeItemLabelPositionFallback | ItemLabelPosition | 'plot.renderer.negativeItemLabelPositionFallback': ['inside9', 'center', 'center', 0] |
| plot.renderer.positiveItemLabelPositionFallback | ItemLabelPosition | 'plot.renderer.positiveItemLabelPositionFallback': ['outside3', 'center', 'center', 0] |
| plot.renderer.shadowPaint | Paint | 'plot.renderer.shadowPaint': '' |
| plot.renderer.shadowVisible | boolean | 'plot.renderer.shadowVisible': false |
| plot.renderer.shadowXOffset | double | 'plot.renderer.shadowXOffset': 0 |
| plot.renderer.shadowYOffset | double | 'plot.renderer.shadowYOffset': 0 |
The following properties are specific to stacked bar charts that use texts on the domain axis.
Table 4.23. StackedBarRenderer properties
| Name | Type | Example |
|---|---|---|
| plot.renderer.renderAsPercentages | boolean | 'plot.renderer.renderAsPercentages': true |
The following properties are specific to line charts that use texts on the domain axis.
Table 4.24. LineAndShapeRenderer properties
| Name | Type | Example |
|---|---|---|
| plot.renderer.baseLinesVisible | boolean | 'plot.renderer.baseLinesVisible': true |
| plot.renderer.baseShapesFilled | boolean | 'plot.renderer.baseShapesFilled': true |
| plot.renderer.baseShapesVisible | boolean | 'plot.renderer.baseShapesVisible': true |
| plot.renderer.drawOutlines | boolean | 'plot.renderer.drawOutlines': true |
| plot.renderer.itemMargin | double | 'plot.renderer.itemMargin': 0.5 |
| plot.renderer.seriesLinesVisible | boolean[] | 'plot.renderer.seriesLinesVisible': [true,true,true] |
| plot.renderer.seriesShapesFilled | boolean[] | 'plot.renderer.seriesShapesFilled': [true,true,true] |
| plot.renderer.seriesShapesVisible | boolean[] | 'plot.renderer.seriesShapesVisible': [true,true,true] |
| plot.renderer.useFillPaint | boolean | 'plot.renderer.useFillPaint': true |
| plot.renderer.useOutlinePaint | boolean | 'plot.renderer.useOutlinePaint': true |
| plot.renderer.useSeriesOffset | boolean | 'plot.renderer.useSeriesOffset': true |
The following properties are specific to area charts that use texts on the domain axis.
Table 4.25. AreaRenderer properties
| Name | Type | Example |
|---|---|---|
| plot.renderer.endType | AreaRendererEndType | 'plot.renderer.endType': 'level' |
The following properties are specific to charts that use dates or numbers on the domain axis.
Table 4.26. AbstractXYItemRenderer properties
| Name | Type | Example |
|---|---|---|
| plot.renderer.baseItemLabelGenerator | XYItemLabelGenerator | 'plot.renderer.baseItemLabelGenerator': '{2}' |
| plot.renderer.legendItemLabelGenerator | XYSeriesLabelGenerator | 'plot.renderer.legendItemLabelGenerator': '{0}' |
| plot.renderer.seriesItemLabelGenerator | XYItemLabelGenerator[] | 'plot.renderer.seriesItemLabelGenerator': ['{2}', '{2}'] |
The following properties are specific to line charts that use dates or numbers on the domain axis.
Table 4.27. XYLineAndShapeRenderer properties
| Name | Type | Example |
|---|---|---|
| plot.renderer.baseLinesVisible | boolean | 'plot.renderer.baseLinesVisible': true |
| plot.renderer.baseShapesFilled | boolean | 'plot.renderer.baseShapesFilled': true |
| plot.renderer.baseShapesVisible | boolean | 'plot.renderer.baseShapesVisible': true |
| plot.renderer.drawOutlines | boolean | 'plot.renderer.drawOutlines': true |
| plot.renderer.drawSeriesLineAsPath | boolean | 'plot.renderer.drawSeriesLineAsPath': true |
| plot.renderer.seriesLinesVisible | boolean[] | 'plot.renderer.seriesLinesVisible': [true,true,true] |
| plot.renderer.seriesShapesFilled | boolean[] | 'plot.renderer.seriesShapesFilled': [true,true,true] |
| plot.renderer.seriesShapesVisible | boolean[] | 'plot.renderer.seriesShapesVisible': [true,true,true] |
| plot.renderer.useFillPaint | boolean | 'plot.renderer.useFillPaint': true |
| plot.renderer.useOutlinePaint | boolean | 'plot.renderer.useOutlinePaint': true |
Table 4.28. XYAreaRenderer properties
| Name | Type | Example |
|---|---|---|
| plot.renderer.legendArea | Shape | 'plot.renderer.legendArea': {'shape': 'rectangle', 'x': 0, 'y': 0, 'width': 5, 'height': 5} |
| plot.renderer.outline | boolean | 'plot.renderer.outline': true |
| plot.renderer.useFillPaint | boolean | 'plot.renderer.useFillPaint': true |
There are two types of domain axes:
-
axes that display discrete values (categories) and
-
axes that display continuous values (dates or numbers).
The following properties are available for all types of axes.
Table 4.29. Axis properties
| Name | Type | Example |
|---|---|---|
| plot.domainAxis.axisLinePaint | Paint | 'plot.domainAxis.axisLinePaint': '#ffffff' |
| plot.domainAxis.axisLineStroke | Stroke | 'plot.domainAxis.axisLineStroke': {'width': 1.0} |
| plot.domainAxis.axisLineVisible | boolean | 'plot.domainAxis.axisLineVisible': true |
| plot.domainAxis.fixedDimension | double | 'plot.domainAxis.fixedDimension': 100 |
| plot.domainAxis.label | String | 'plot.domainAxis.label': 'Domain' |
| plot.domainAxis.labelAngle | double |
Angle value is expressed in radians. 'plot.domainAxis.labelAngle': 1.57 |
| plot.domainAxis.labelFont | Font | 'plot.domainAxis.labelFont': {'size': 8} |
| plot.domainAxis.labelInsets | RectangleInsets | 'plot.domainAxis.labelInsets': [2, 2, 2, 2] |
| plot.domainAxis.labelLocation | AxisLabelLocation | 'plot.domainAxis.labelLocation': 'middle' |
| plot.domainAxis.labelPaint | Paint | 'plot.domainAxis.labelPaint': '#ffffff' |
| plot.domainAxis.minorTickMarkInsideLength | int | 'plot.domainAxis.minorTickMarkInsideLength': 5 |
| plot.domainAxis.minorTickMarkOutsideLength | int | 'plot.domainAxis.minorTickMarkOutsideLength': 5 |
| plot.domainAxis.minorTickMarksVisible | boolean | 'plot.domainAxis.minorTickMarksVisible': true |
| plot.domainAxis.tickLabelFont | Font | 'plot.domainAxis.tickLabelFont': {'size': 6} |
| plot.domainAxis.tickLabelInsets | RectangleInsets | 'plot.domainAxis.tickLabelInsets': [2, 2, 2, 2] |
| plot.domainAxis.tickLabelPaint | Paint | 'plot.domainAxis.tickLabelPaint': '#ffffff' |
| plot.domainAxis.tickLabelsVisible | boolean | 'plot.domainAxis.tickLabelsVisible': true |
| plot.domainAxis.tickMarkInsideLength | float | 'plot.domainAxis.tickMarkInsideLength': 5 |
| plot.domainAxis.tickMarkOutsideLength | float | 'plot.domainAxis.tickMarkOutsideLength': 5 |
| plot.domainAxis.tickMarkPaint | Paint | 'plot.domainAxis.tickMarkPaint': '#ff0000' |
| plot.domainAxis.tickMarkStroke | Stroke | 'plot.domainAxis.tickMarkStroke': {'width': 1.0} |
| plot.domainAxis.tickMarksVisible | boolean | 'plot.domainAxis.tickMarksVisible': true |
| plot.domainAxis.visible | boolean | 'plot.domainAxis.visible': true |
The following properties are available for axes that display categories.
Table 4.30. CategoryAxis properties
| Name | Type | Example |
|---|---|---|
| plot.domainAxis.categoryLabelPositionOffset | int | 'plot.domainAxis.categoryLabelPositionOffset': 5 |
| plot.domainAxis.categoryLabelPositions | Not supported | N/A |
| plot.domainAxis.categoryMargin | double | 'plot.domainAxis.categoryMargin': 0.01 |
| plot.domainAxis.lowerMargin | double | 'plot.domainAxis.lowerMargin': 0.01 |
| plot.domainAxis.maximumCategoryLabelLines | int | 'plot.domainAxis.maximumCategoryLabelLines': 1 |
| plot.domainAxis.maximumCategoryLabelWidthRatio | float | 'plot.domainAxis.maximumCategoryLabelWidthRatio': 0.5 |
| plot.domainAxis.upperMargin | double | 'plot.domainAxis.upperMargin': 0.01 |
The following properties are available for axes that display continuous values like numbers and dates.
Table 4.31. ValueAxis properties
| Name | Type | Example |
|---|---|---|
| plot.domainAxis.autoRange | boolean | 'plot.domainAxis.autoRange': true |
| plot.domainAxis.autoRangeMinimumSize | double | 'plot.domainAxis.autoRangeMinimumSize': 1 |
| plot.domainAxis.autoTickUnitSelection | boolean | 'plot.domainAxis.autoTickUnitSelection': true |
| plot.domainAxis.defaultAutoRange | Range | 'plot.domainAxis.defaultAutoRange': [0, 10] |
| plot.domainAxis.downArrow | Shape | 'plot.domainAxis.downArrow': {'shape': 'down-triangle', 'size': 3} |
| plot.domainAxis.fixedAutoRange | double | 'plot.domainAxis.fixedAutoRange': 50 |
| plot.domainAxis.inverted | boolean | 'plot.domainAxis.inverted': true |
| plot.domainAxis.leftArrow | Shape | 'plot.domainAxis.leftArrow': {'shape': 'left-triangle', 'size': 3} |
| plot.domainAxis.lowerBound | double | 'plot.domainAxis.lowerBound': 0 |
| plot.domainAxis.lowerMargin | double | 'plot.domainAxis.lowerMargin': 0.01 |
| plot.domainAxis.minorTickCount | int | 'plot.domainAxis.minorTickCount': 10 |
| plot.domainAxis.negativeArrowVisible | boolean | 'plot.domainAxis.negativeArrowVisible': true |
| plot.domainAxis.positiveArrowVisible | boolean | 'plot.domainAxis.positiveArrowVisible': true |
| plot.domainAxis.range | Range | 'plot.domainAxis.range': [2, 20] |
| plot.domainAxis.rangeWithMargins | Range | 'plot.domainAxis.rangeWithMargins': [2, 20] |
| plot.domainAxis.rightArrow | Shape | 'plot.domainAxis.rightArrow': {'shape': 'right-triangle', 'size': 3} |
| plot.domainAxis.upArrow | Shape | 'plot.domainAxis.upArrow': {'shape': 'up-triangle', 'size': 3} |
| plot.domainAxis.upperBound | double | 'plot.domainAxis.upperBound': 20 |
| plot.domainAxis.upperMargin | double | 'plot.domainAxis.upperMargin': 0.01 |
| plot.domainAxis.verticalTickLabels | boolean | 'plot.domainAxis.verticalTickLabels': true |
The following properties are available for axes that display numbers.
Table 4.32. NumberAxis properties
| Name | Type | Example |
|---|---|---|
| plot.domainAxis.autoRangeIncludesZero | boolean | 'plot.domainAxis.autoRangeIncludesZero': true |
| plot.domainAxis.autoRangeStickyZero | boolean | 'plot.domainAxis.autoRangeStickyZero': true |
| plot.domainAxis.markerBand | Not supported | N/A |
| plot.domainAxis.numberFormatOverride | NumberFormat | 'plot.domainAxis.numberFormatOverride': '0.000' |
| plot.domainAxis.rangeType | RangeType | 'plot.domainAxis.rangeType': 'full' |
| plot.domainAxis.tickUnit | NumberTickUnit | 'plot.domainAxis.tickUnit': {'size': 50} |
The following properties are available for axes that display dates (including time).
Table 4.33. DateAxis properties
| Name | Type | Example |
|---|---|---|
| plot.domainAxis.dateFormatOverride | DateFormat | 'plot.domainAxis.dateFormatOverride': 'MMM dd' |
| plot.domainAxis.locale | Locale | 'plot.domainAxis.locale': 'fr_FR' |
| plot.domainAxis.maximumDate | Date | 'plot.domainAxis.maximumDate': '2015-01-01'?date.iso |
| plot.domainAxis.minimumDate | Date | 'plot.domainAxis.minimumDate': '2015-01-01T10:30:00'?datetime.iso |
| plot.domainAxis.range | Range | 'plot.domainAxis.range': ['10:30'?time.iso, '12:35'?time.iso] |
| plot.domainAxis.tickMarkPosition | DateTickMarkPosition | 'plot.domainAxis.tickMarkPosition': 'middle' |
| plot.domainAxis.tickUnit | DateTickUnit | 'plot.domainAxis.tickUnit': {'unitType': 'hour', 'multiple': 2} |
| plot.domainAxis.timeline | Not supported (may be removed in version 2) | N/A |
| plot.domainAxis.timezone | TimeZone | 'plot.domainAxis.timezone': 'GMT' |
Unlike the domain axis, the range axis displays only continuous values (dates or numbers). The following properties are available for all types of axes.
Table 4.34. Axis properties
| Name | Type | Example |
|---|---|---|
| plot.rangeAxis.axisLinePaint | Paint | 'plot.rangeAxis.axisLinePaint': '#ffffff' |
| plot.rangeAxis.axisLineStroke | Stroke | 'plot.rangeAxis.axisLineStroke': {'width': 1.0} |
| plot.rangeAxis.axisLineVisible | boolean | 'plot.rangeAxis.axisLineVisible': true |
| plot.rangeAxis.fixedDimension | double | 'plot.rangeAxis.fixedDimension': 100 |
| plot.rangeAxis.label | String | 'plot.rangeAxis.label': 'Range' |
| plot.rangeAxis.labelAngle | double |
Angle value is expressed in radians. 'plot.rangeAxis.labelAngle': 1.57 |
| plot.rangeAxis.labelFont | Font | 'plot.rangeAxis.labelFont': {'size': 8} |
| plot.rangeAxis.labelInsets | RectangleInsets | 'plot.rangeAxis.labelInsets': [2, 2, 2, 2] |
| plot.rangeAxis.labelLocation | AxisLabelLocation | 'plot.rangeAxis.labelLocation': 'middle' |
| plot.rangeAxis.labelPaint | Paint | 'plot.rangeAxis.labelPaint': '#ffffff' |
| plot.rangeAxis.minorTickMarkInsideLength | int | 'plot.rangeAxis.minorTickMarkInsideLength': 1 |
| plot.rangeAxis.minorTickMarkOutsideLength | int | 'plot.rangeAxis.minorTickMarkOutsideLength': 1 |
| plot.rangeAxis.minorTickMarksVisible | boolean | 'plot.rangeAxis.minorTickMarksVisible': true |
| plot.rangeAxis.tickLabelFont | Font | 'plot.rangeAxis.tickLabelFont': {'size': 6} |
| plot.rangeAxis.tickLabelInsets | RectangleInsets | 'plot.rangeAxis.tickLabelInsets': [2, 2, 2, 2] |
| plot.rangeAxis.tickLabelPaint | Paint | 'plot.rangeAxis.tickLabelPaint': '#ff0000' |
| plot.rangeAxis.tickLabelsVisible | boolean | 'plot.rangeAxis.tickLabelsVisible': true |
| plot.rangeAxis.tickMarkInsideLength | float | 'plot.rangeAxis.tickMarkInsideLength': 5 |
| plot.rangeAxis.tickMarkOutsideLength | float | 'plot.rangeAxis.tickMarkOutsideLength': 5 |
| plot.rangeAxis.tickMarkPaint | Paint | 'plot.rangeAxis.tickMarkPaint': '#ffffff' |
| plot.rangeAxis.tickMarkStroke | Stroke | 'plot.rangeAxis.tickMarkStroke': {'width': 1.0} |
| plot.rangeAxis.tickMarksVisible | boolean | 'plot.rangeAxis.tickMarksVisible': true |
| plot.rangeAxis.visible | boolean | 'plot.rangeAxis.visible': true |
The following properties are available for axes that display continuous values like dates or numbers.
Table 4.35. ValueAxis properties
| Name | Type | Example |
|---|---|---|
| plot.rangeAxis.autoRangeMinimumSize | double | 'plot.rangeAxis.autoRangeMinimumSize': 1 |
| plot.rangeAxis.autoRange | boolean | 'plot.rangeAxis.autoRange': true |
| plot.rangeAxis.autoTickUnitSelection | boolean | 'plot.rangeAxis.autoTickUnitSelection': true |
| plot.rangeAxis.defaultAutoRange | Range | 'plot.rangeAxis.defaultAutoRange': [0, 10] |
| plot.rangeAxis.downArrow | Shape | 'plot.rangeAxis.downArrow': {'shape': 'down-triangle', 'size': 3} |
| plot.rangeAxis.fixedAutoRange | double | 'plot.rangeAxis.fixedAutoRange': 50 |
| plot.rangeAxis.inverted | boolean | 'plot.rangeAxis.inverted': true |
| plot.rangeAxis.leftArrow | Shape | 'plot.rangeAxis.leftArrow': {'shape': 'left-triangle', 'size': 3} |
| plot.rangeAxis.lowerBound | double | 'plot.rangeAxis.lowerBound': 0 |
| plot.rangeAxis.lowerMargin | double | 'plot.rangeAxis.lowerMargin': 0.01 |
| plot.rangeAxis.minorTickCount | int | 'plot.rangeAxis.minorTickCount': 10 |
| plot.rangeAxis.negativeArrowVisible | boolean | 'plot.rangeAxis.negativeArrowVisible': true |
| plot.rangeAxis.positiveArrowVisible | boolean | 'plot.rangeAxis.positiveArrowVisible': true |
| plot.rangeAxis.range | Range | 'plot.rangeAxis.range': [2, 20] |
| plot.rangeAxis.rangeWithMargins | Range | 'plot.rangeAxis.rangeWithMargins': [2, 20] |
| plot.rangeAxis.rightArrow | Shape | 'plot.rangeAxis.rightArrow': {'shape': 'right-triangle', 'size': 3} |
| plot.rangeAxis.upArrow | Shape | 'plot.rangeAxis.upArrow': {'shape': 'up-triangle', 'size': 3} |
| plot.rangeAxis.upperBound | double | 'plot.rangeAxis.upperBound': 20 |
| plot.rangeAxis.upperMargin | double | 'plot.rangeAxis.upperMargin': 0.01 |
| plot.rangeAxis.verticalTickLabels | boolean | 'plot.rangeAxis.verticalTickLabels': true |
The following properties are available for axes that display numbers.
Table 4.36. NumberAxis properties
| Name | Type | Example |
|---|---|---|
| plot.rangeAxis.autoRangeIncludesZero | boolean | 'plot.rangeAxis.autoRangeIncludesZero': true |
| plot.rangeAxis.autoRangeStickyZero | boolean | 'plot.rangeAxis.autoRangeStickyZero': true |
| plot.rangeAxis.markerBand | Not supported | N/A |
| plot.rangeAxis.numberFormatOverride | NumberFormat | 'plot.rangeAxis.numberFormatOverride': '0.000' |
| plot.rangeAxis.rangeType | RangeType | 'plot.rangeAxis.rangeType': 'full' |
| plot.rangeAxis.tickUnit | NumberTickUnit | 'plot.rangeAxis.tickUnit': {'size': 50} |
|
Copyright © 2006-2020 Fanurio Time Tracking SRL |