What's new at Fanurio
The latest news about product updates and everything else related to Fanurio.
Fanurio 3.2 Beta1 Released - Introducing report charts
July 12, 2016
Version 3.2-beta1 is now available for download.
This version can be used in production but we're not releasing it officially yet because we want to know what you think about the new report charts. For a complete list of all the new features and improvements (there are quite a few), please see the change log.
Important: If you are using version 4.0-beta1, you should install version 4.0-beta2. All the new features and improvements implemented for version 3.2-beta1 are also included in version 4.0-beta2 released today.
Introducing report charts
Reports tend to contain lots of data and it's very likely that you thought about using charts to make them easier to analyze.
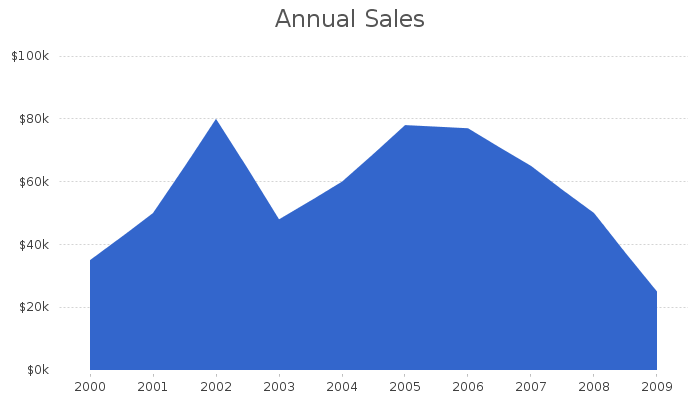
If you have some programming skills, you've probably done this already by using an online charts library like Google Charts. This new version of Fanurio makes it possible to add charts to your reports without relying on an external library. Fanurio can create area charts, bar charts, line charts, pie charts and ring charts. More charts may be added in the future.
Since we are not providing a charts editor, all charts have to be coded manually (see the charts guide for more details). However, you don't have to learn how to create a chart, just tell us what you need and we'll create it for you.
This version doesn't come with preinstalled chart reports but we are including a few here so you can test the charts supported by Fanurio with your data. You may want similar reports for time, trips or invoices.
-
Expense report without a chart. [Sample]
-
Expense report with a ring chart that shows totals by expense category. [Sample]
-
Expense report with a bar chart that shows totals by expense category. [Sample]
-
Expense report with a line chart that shows totals by date. [Sample]
-
Expense report with an area chart that shows totals by date. [Sample]
Please follow these steps to test them in Fanurio:
-
Download the templates archive.
-
Unzip the archive on your computer.
-
Go to File | Show Templates | Expenses Reports to open the templates folder.
-
Copy the files extracted at step #2 to the templates folder opened at step #3.
-
Go to Reports | Expenses Report to create a report.
-
Choose the template that you want to test from the Templates dropdown box.
-
Click Update to see the report.
As always, we'd love to know what you think about the new version and whether you need chart reports or not.